Aug 08, 2022
CF DACS In Practice: ETH drives Crypto Bounce
Why has the digital asset price rebound largely outpaced the bounce by other 'risky' assets? CF Benchmarks' Research Lead Gabe Selby, CFA, has some pointers - backed by the CF Digital Asset Classification Structure (CF DACS)
By Gabe Selby, CFA - Research Lead, CF Benchmarks
Digital assets, as measured by the CF Diversified Large Cap Index, have risen approximately 34.4% since the June lows. This performance has so far outpaced most other “risky” assets, such as equities, leading practitioners to wonder: What has been driving this excess performance? Answer: investors who are interested in uncovering the main performance drivers can now utilize our proprietary Digital Asset Classification Structure (DACS).
Digital assets have long lacked a coherent classification structure to allow professional investors the ability to better understand their underlying exposure in their respective portfolios. Thus, the team here at CF Benchmarks has been hard at work to create a precise, yet flexible framework for our clients and the overall investing public to utilize.
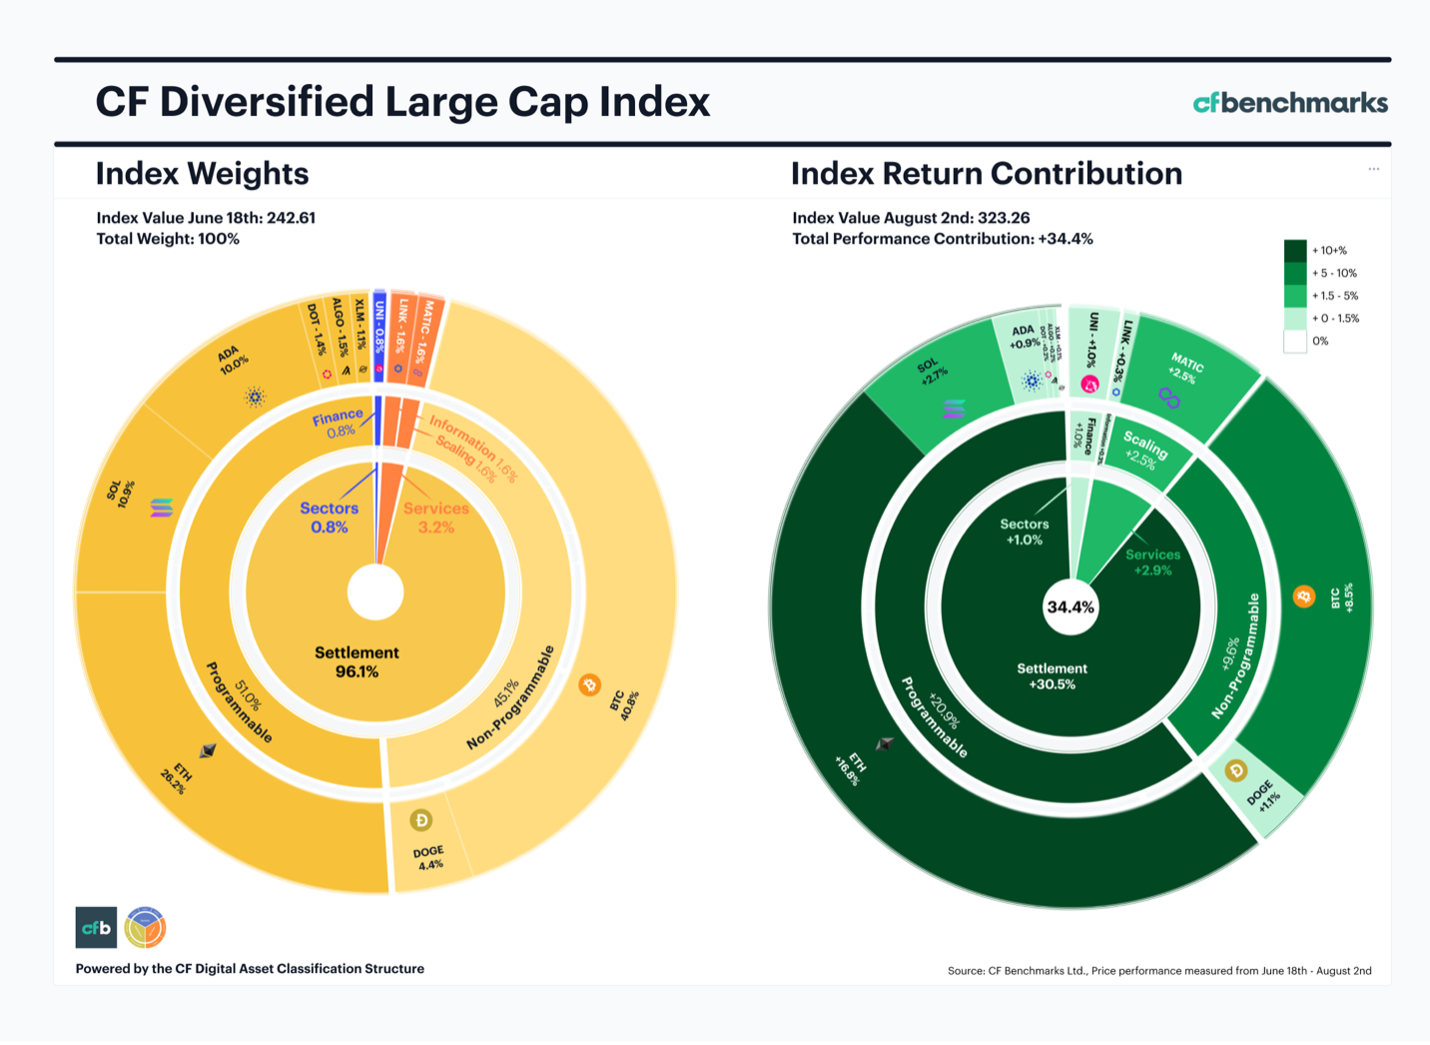
In short, the DACS multi-level framework is designed to categorize assets through a purpose-centric lens that allocates digital tokens into our mutually exclusive classifications. As illustrated below, the initial layer of our categories consists of three major segments: Sectors, Services and Settlement. From there, each of the initial three categories contains a second layer for classifying each digital asset which further narrows down to a more specific use case.
Since the June 18th bottom, markets have seen a strong overall recovery that has stemmed from a series of bullish narratives. Yet, when taking a closer look at the index performance, one can clearly identify that the price appreciation of ETH in that time has been the biggest driver of the overall market recovery. In fact, the visualization below illustrates that approximately half of the total performance can be attributed to ETH. The micro-catalyst for this positive price action was sparked by the recent announcement of the highly anticipated Proof-of-Stake (PoS) blockchain merge that is now scheduled for September.

It is also worth noting that ETH’s positive price performance, has had some “spill-over” impact to its closest competitor in the programmable sub-category, Solana, which saw its +25% price appreciation contribute just over 2.7% of the total performance contribution. This also made it the third largest driver of price performance, just behind Bitcoin (+8.5%), which carries a much larger relative weight in the CF Diversified Large Cap Index.
To learn more about the CF Digital Asset Classification Structure, please find our in-depth methodology guide here.
The information contained within is for educational and informational purposes ONLY. It is not intended nor should it be considered an invitation or inducement to buy or sell any of the underlying instruments cited including but not limited to cryptoassets, financial instruments or any instruments that reference any index provided by CF Benchmarks Ltd. This communication is not intended to persuade or incite you to buy or sell security or securities noted within. Any commentary provided is the opinion of the author and should not be considered a personalised recommendation. Please contact your financial adviser or professional before making an investment decision.
Note: Some of the underlying instruments cited within this material may be restricted to certain customer categories in certain jurisdictions.

CF Benchmarks

CF Benchmarks

Ken Odeluga


