Dec 09, 2022
Quarterly Attribution Report: CF Blockchain Infrastructure Index
The CF Blockchain Infrastructure Index is a liquid, investible benchmark portfolio index that tracks the return performance of blockchain services within the Digital Asset space. The index seeks to capture returns of all eligible protocols under the Services category of the CF Digital Asset Classification Structure. Index constituents are weighted by using a capped free-float market capitalisation in accordance with the CF Digital Asset Series Ground Rules and the index methodology.
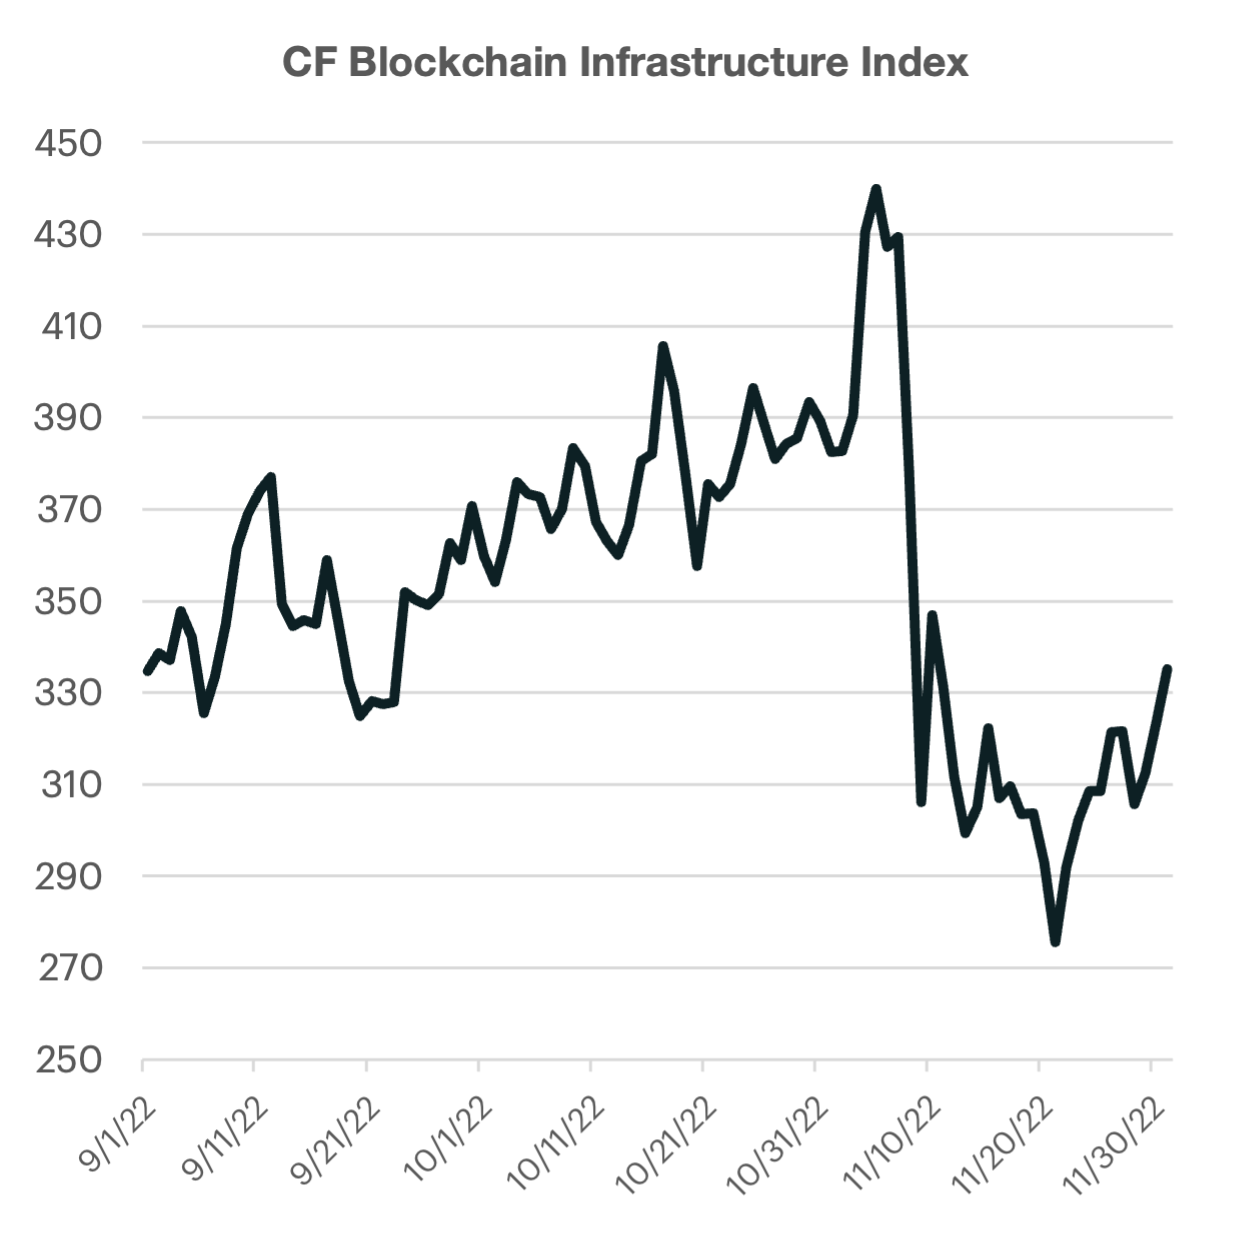
Infrastructure nets neutral
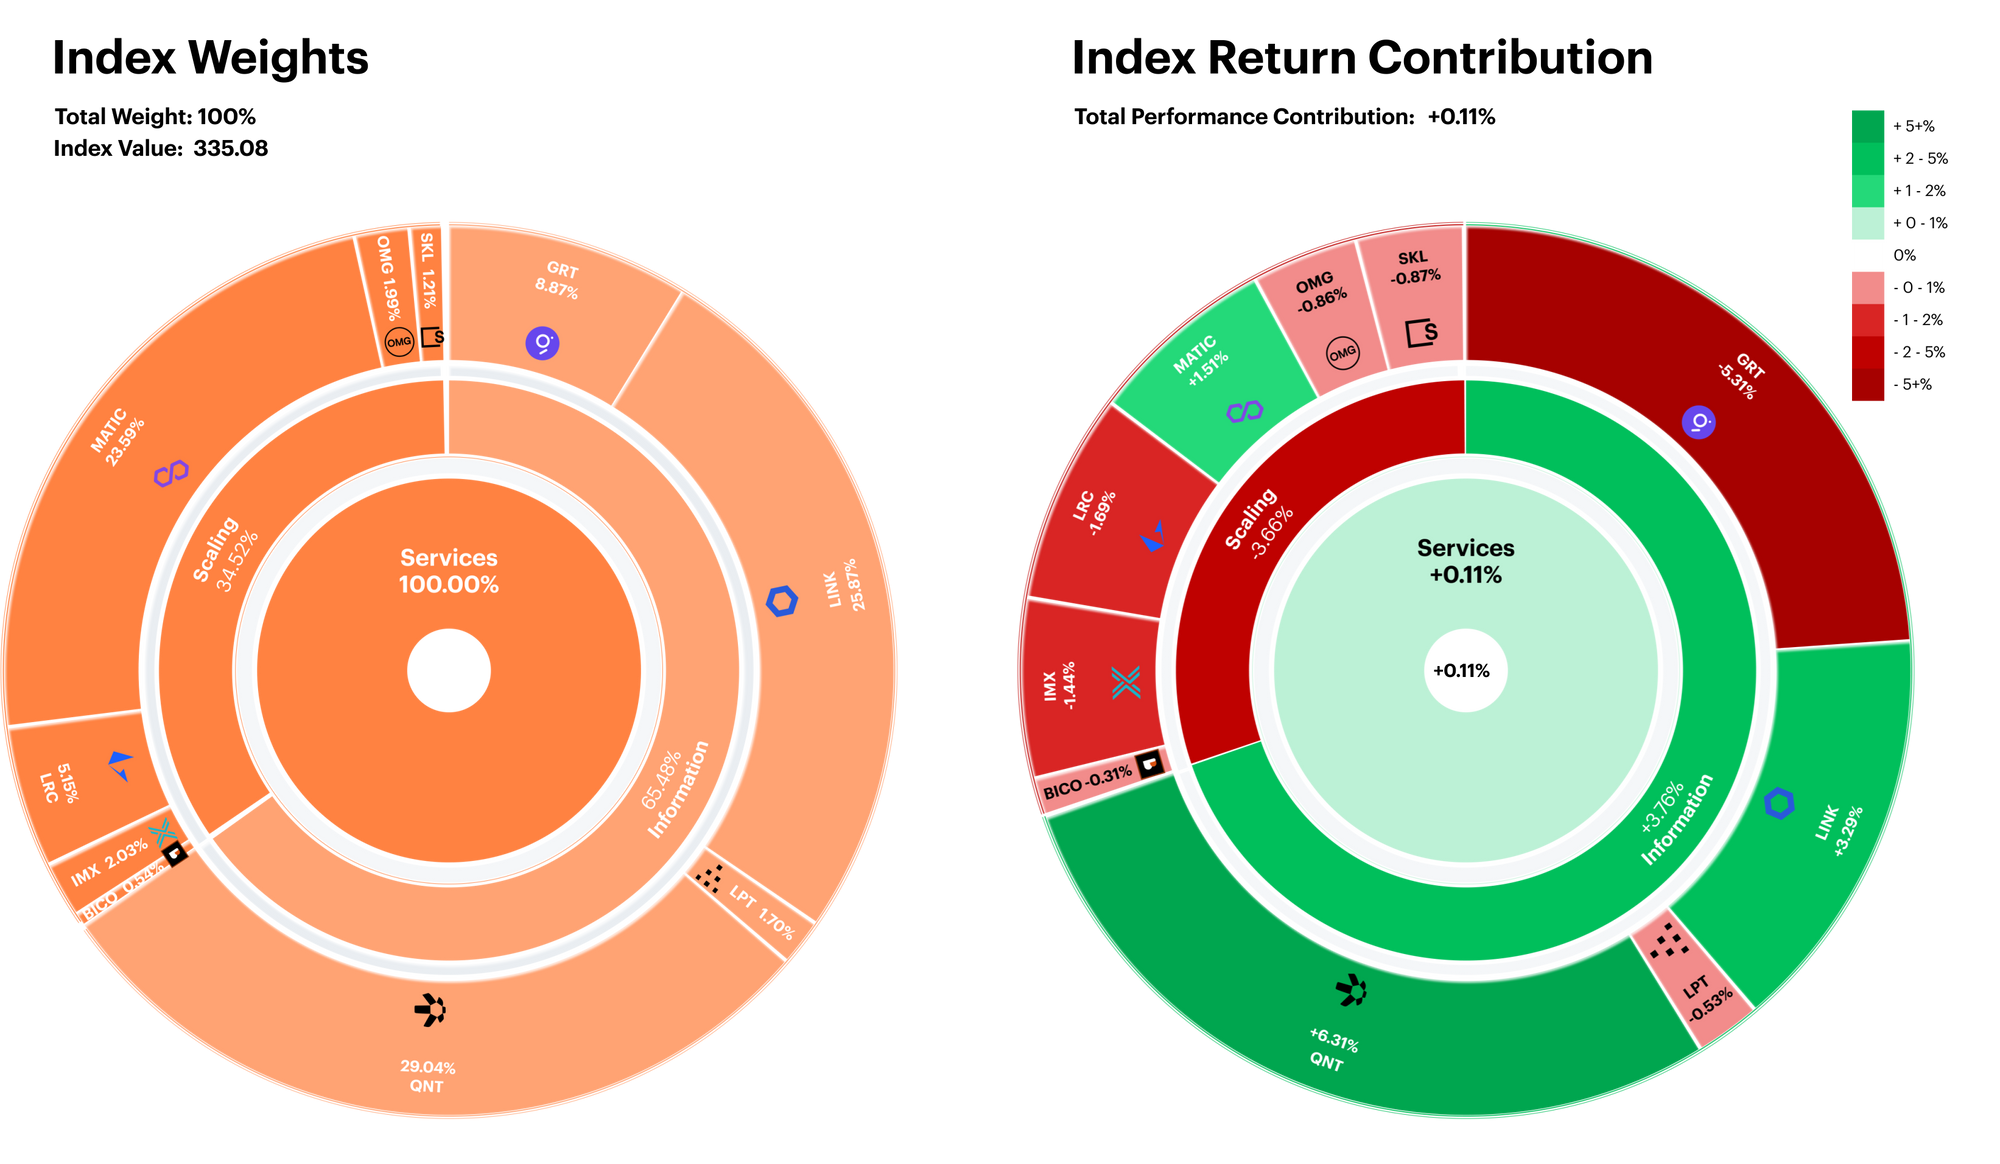
The CF Blockchain Infrastructure Index finished the rebalancing period mostly flat, notching a +0.11% increase in value. The index composition has a slight bias toward Scaling protocols, which contributed -3.7% of negative performance. This was offset by the positive +3.8% contribution from the Information segment.
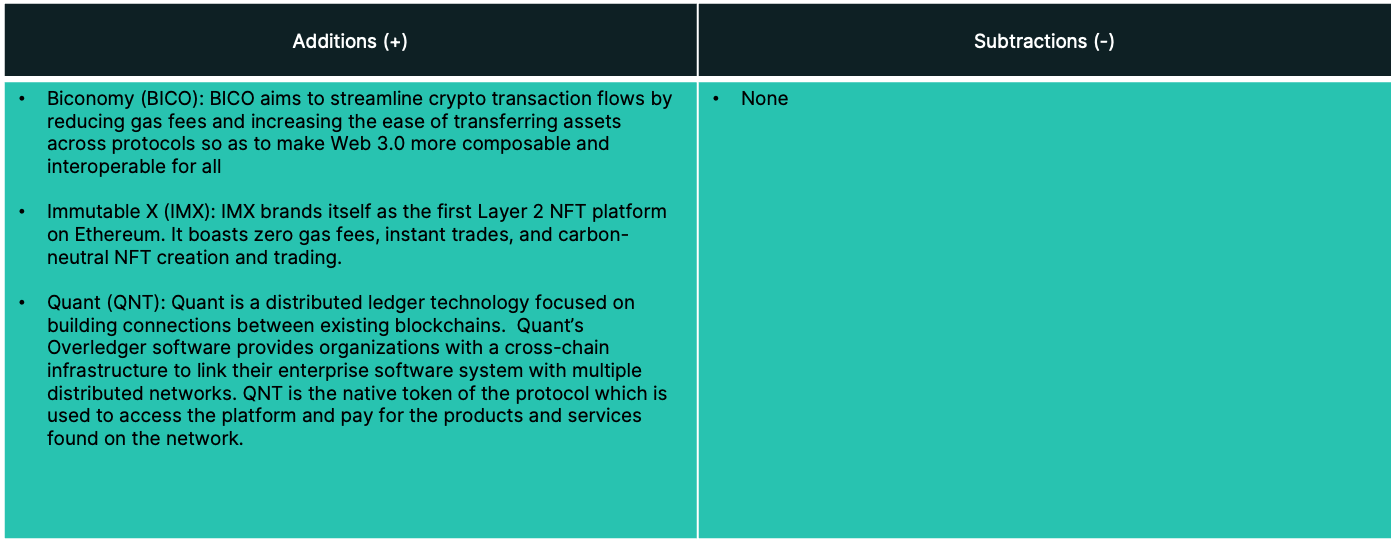
From an individual asset level, recently added Quant (QNT) contributed the most positive performance (+6.3%) due to its sizable weight and stellar performance.
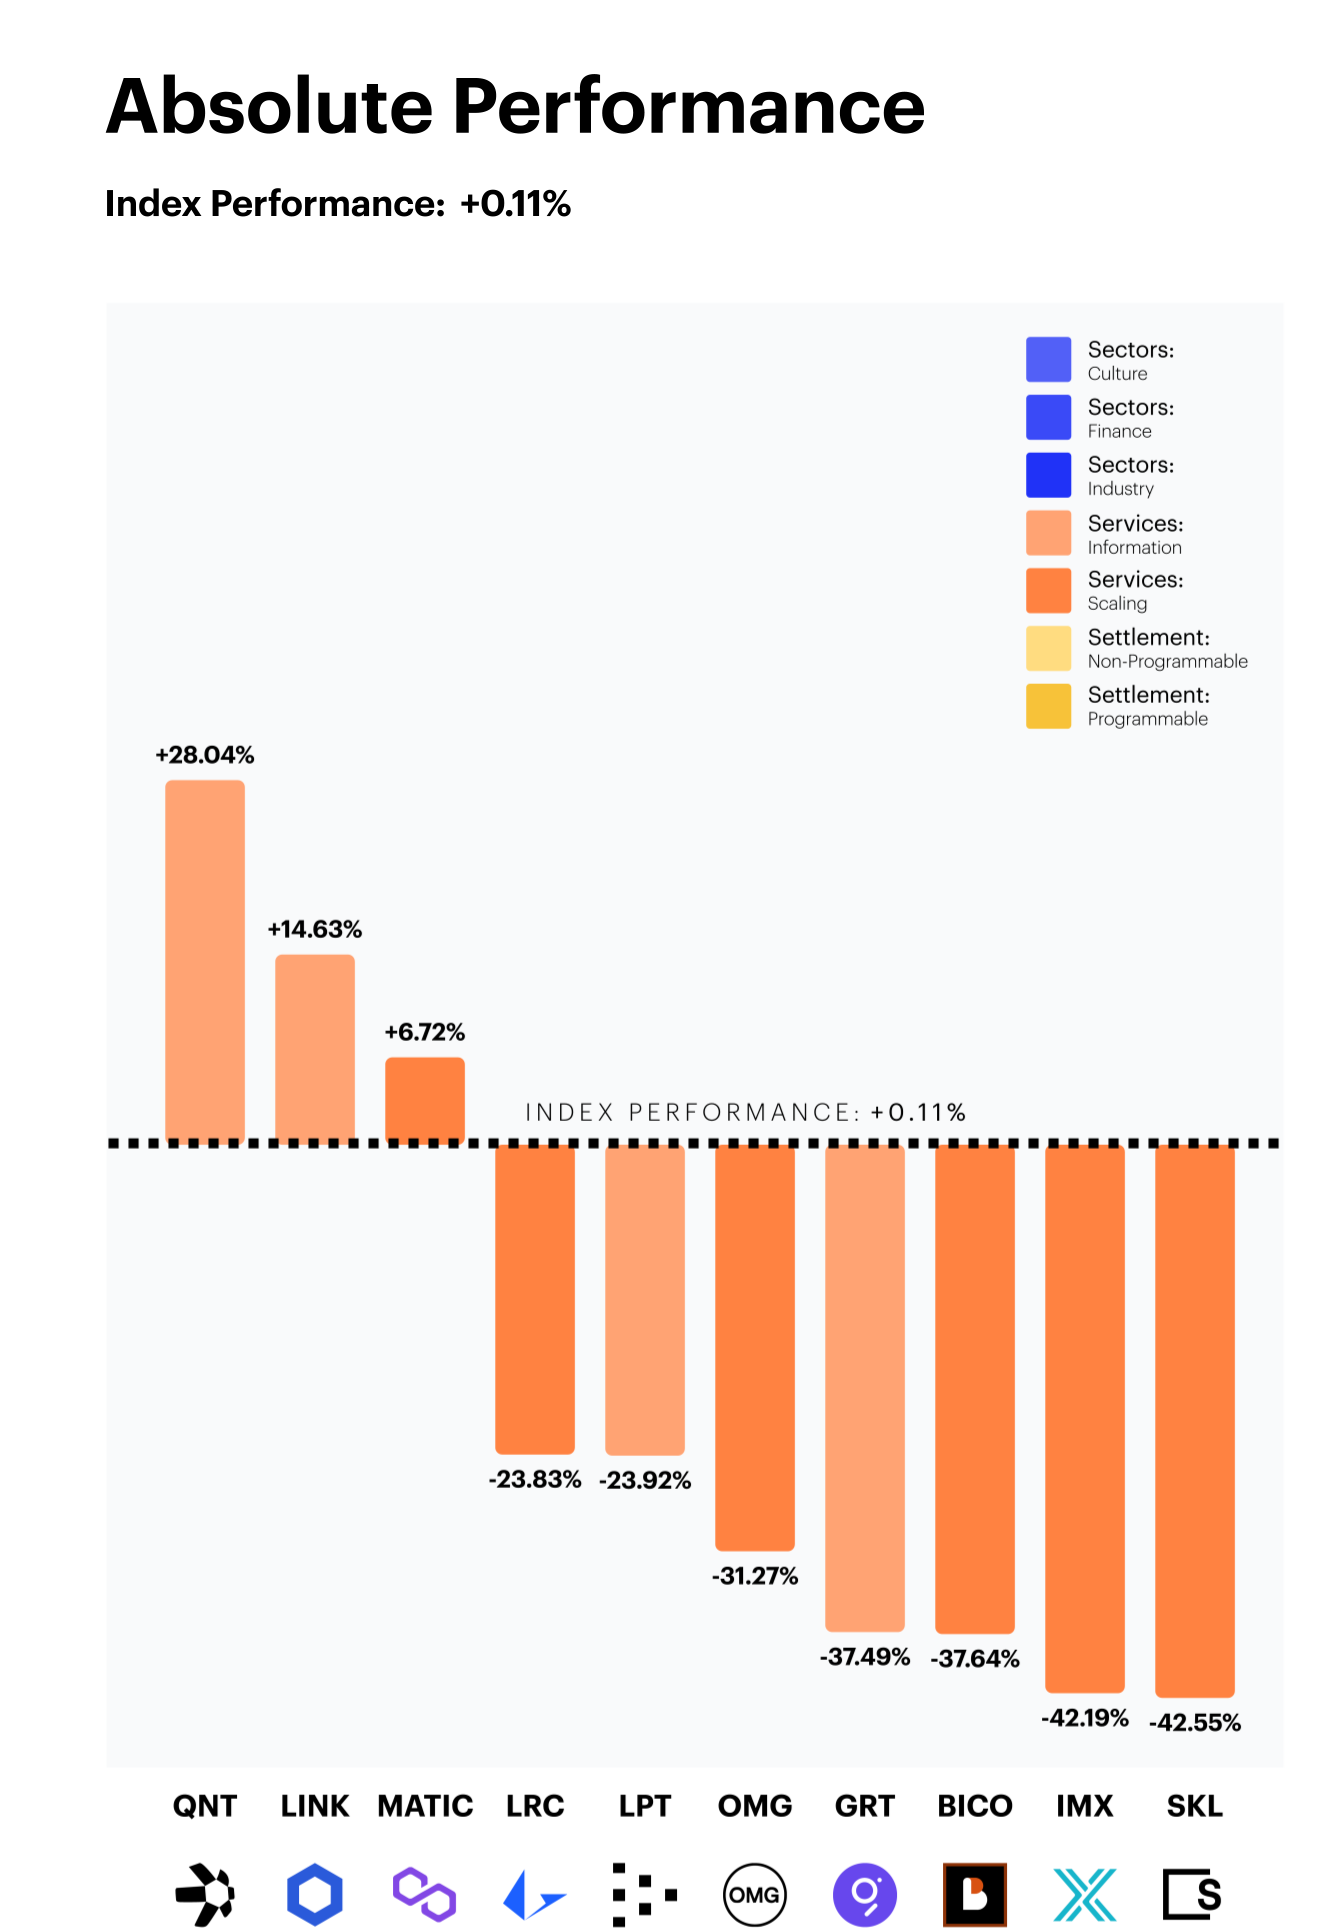
Select standouts mask broadly negative breadth
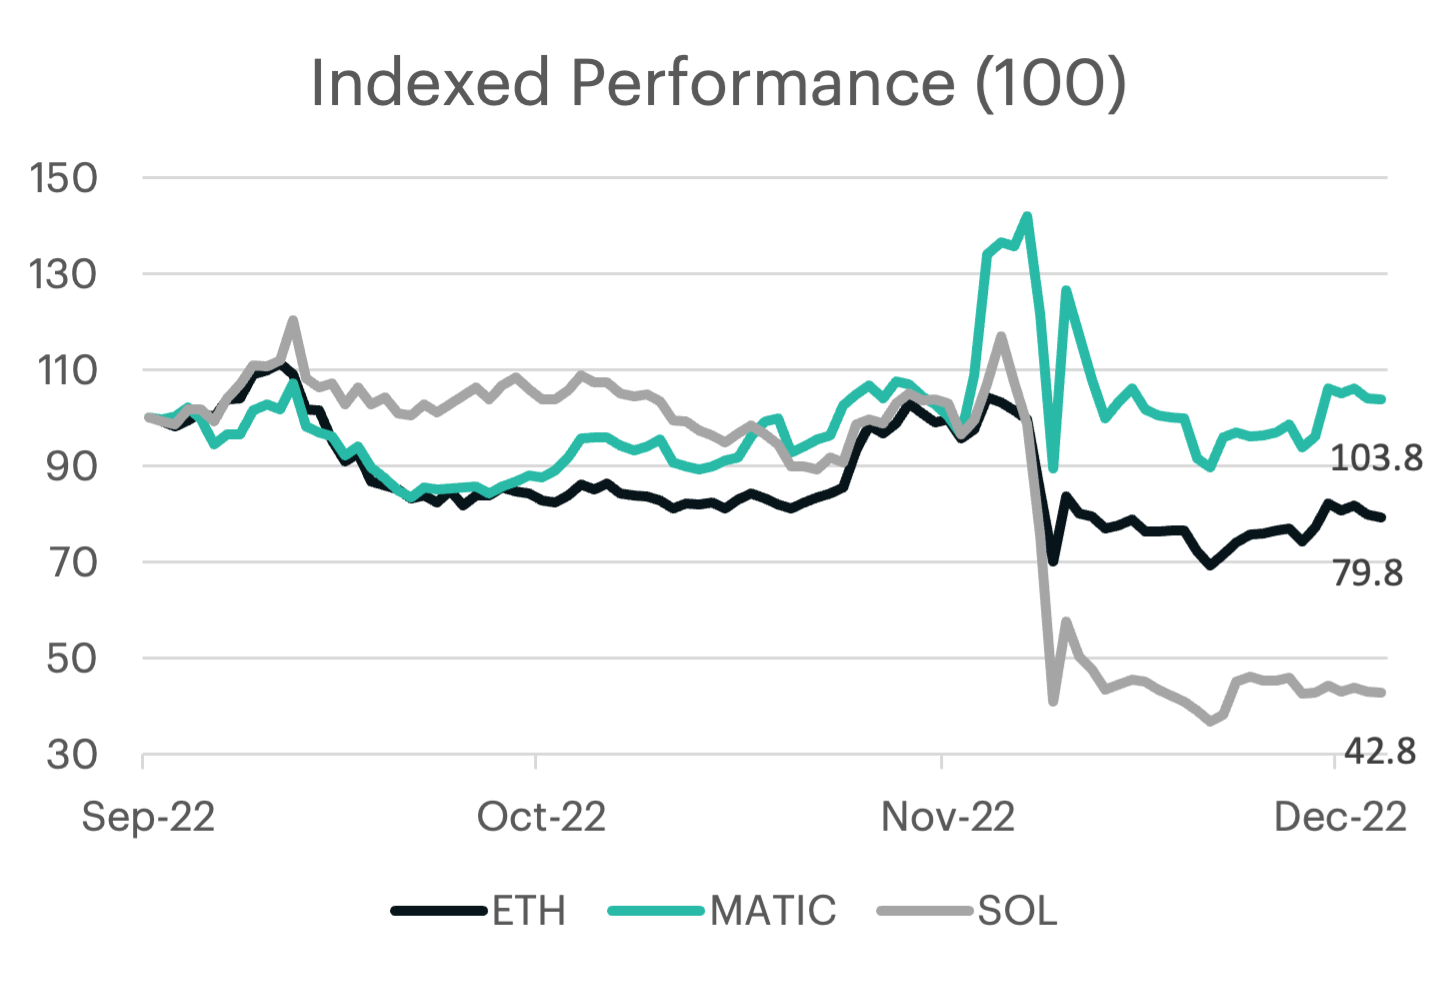
Although it may appear that the performance of our Blockchain Infrastructure Index finished the quarter in a truly split fashion, most tokens in each category ended the rebalance period in negative territory. Information saw Quant (QNT) and Chainlink (LINK), lead their peer group. QNT has seen strong bouts of price outperformance as a series of developer upgrades and strategic partnerships helped maintain positive price momentum. Meanwhile, LINK’s recent announcement of the launch of its novel staking program has garnered investor interest. Lastly, MATIC, a Scaling protocol continued to display defensive pricing characteristics in a broadly negative environment.
Major laggards included Skale (SKL) and Immutable X (IMX), which both saw steep declines following the collapse of FTX/Alameda.
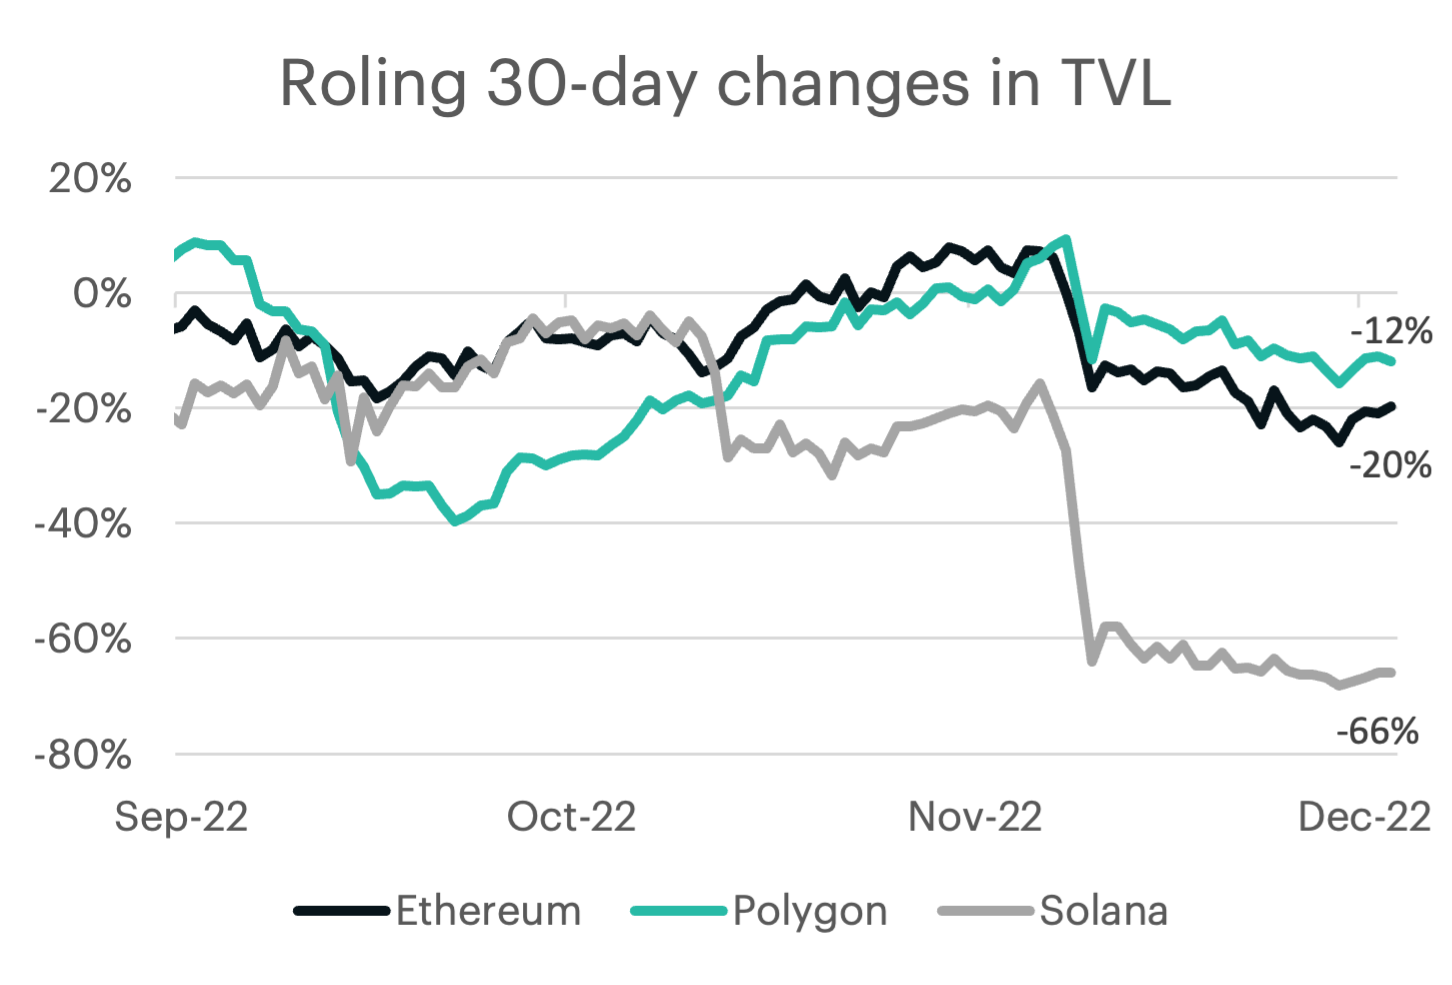
TVL fundamentals post FTX
The surprise collapse of FTX has had a profound impact on the price performance of some of our leading Blockchain Infrastructure constituents. One way to better explain this is to analyse the change in the Total Value Locked (TVL), which can be seen as a fundamental metric for activity. Solana’s exposure to FTX (through reported investments and custodied assets), has caused the amount of TVL on the blockchain to decrease 66% since September 1st. This decrease was much more profound than its peers, and the market price of SOL has proportionately reflected this, falling almost 60% over the same time period.
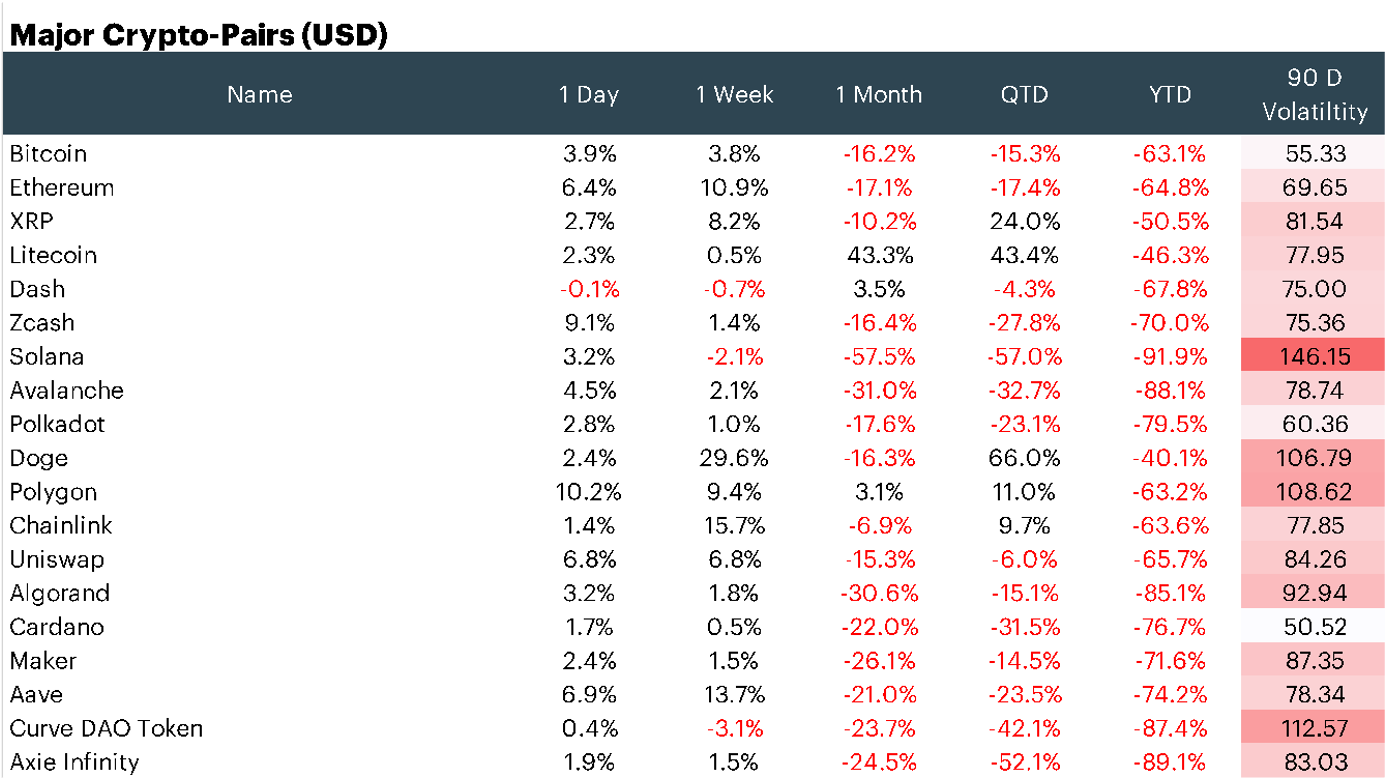
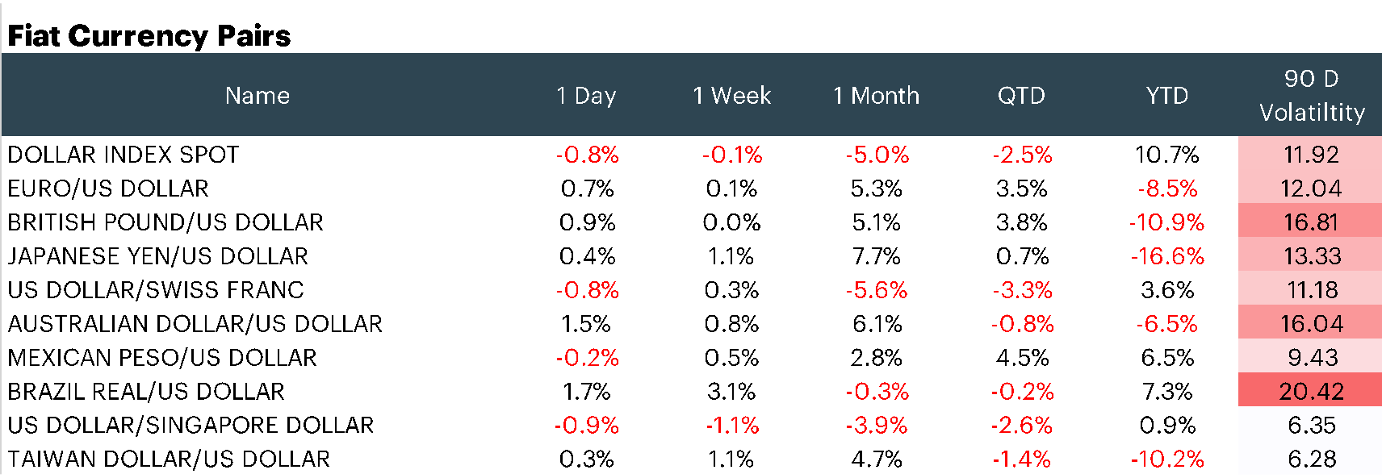
Appendix: Market Performance Overview


Appendix: constituent changes for current period
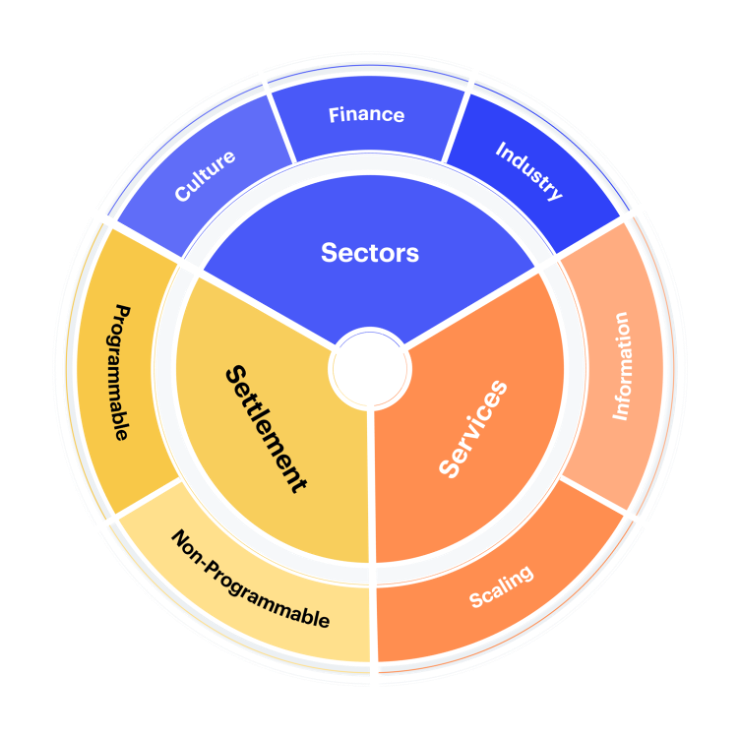
Appendix: CF Digital Asset Classification Structure
The CF Digital Asset Classification Structure (DACS) classifies coins and tokens based on the services that the associated software protocol delivers to end users, grouping assets by the role they play in delivering services to end users. The CF DACS powers CF Benchmarks' sector composite and category portfolio indices and allows users to perform attribution analysis to better understand the fundamental drivers of returns within their digital asset portfolios.
Additional Resources
For more information about our CF Benchmark indices and our methodologies, please visit the respective web links below:
- CF Diversified Large Cap Index
- CF DeFi Composite Index
- CF Web 3.0 Smart Contract Platforms Index
- CF Digital Culture Composite Index
- CF Blockchain Infrastructure Index
- CF Cryptocurrency Ultra Cap 5 Index
Contact Us
Have a question or would like to chat? If so, please drop us a line to:
The information contained within is for educational and informational purposes ONLY. It is not intended nor should it be considered an invitation or inducement to buy or sell any of the underlying instruments cited including but not limited to cryptoassets, financial instruments or any instruments that reference any index provided by CF Benchmarks Ltd. This communication is not intended to persuade or incite you to buy or sell security or securities noted within. Any commentary provided is the opinion of the author and should not be considered a personalised recommendation. Please contact your financial adviser or professional before making an investment decision.
Note: Some of the underlying instruments cited within this material may be restricted to certain customer categories in certain jurisdictions.

CF Benchmarks

CF Benchmarks

Ken Odeluga


