Dec 06, 2023
Optimizing Capital Efficiency in Replicating the BRRNY for the Creation and Redemption of Shares for US Spot Bitcoin ETFs
CME CF Constituent Exchange Liquidity During the Bitcoin Reference Rate - New York Variant Observation Window of 1500 to 1600 ET
Pending US Spot Bitcoin ETFs
The anticipation of spot bitcoin ETFs in the U.S. has continued to drive interest in bitcoin globally. Since BlackRock first filed an S-1 registration statement on June 15th, 2023 the CME CF Bitcoin Reference Rate - New York Variant (BRRNY) has traded up from $25,401.77 to $41,842.42 (1), an increase of almost 65%.
There has been much speculation as to how the listing of spot bitcoin ETFs will impact the bitcoin market, with many papers published speculating as to the amount of assets that these ETFs will gather, if approved, and where that might drive the price of bitcoin. This paper does not seek to add to the spate of speculation on demand, but instead seeks to understand how Authorised Participants and Lead Market Makers of the spot bitcoin ETFs might best be able to procure or dispose of bitcoins when required by spot Bitcoin ETF investors, in a capital efficient manner, if and when the ETFs are listed for trading.
This question doesn’t just pertain to the operational efficiencies of a few major Wall Street banks and trading houses, as any frictions and inefficiencies in the process of acquiring and disposing of bitcoins will manifest themselves in wider spreads for the secondary trading of the ETF shares, and hence would be detrimental to ETF Investors and the potential for asset gathering.
At the time of writing, there are 13 proposed spot bitcoin ETFs from a variety of issuers. Fully 7 of these propose to strike NAV to the BRRNY, including those proposed by the highest profile and most sizable ETF Issuers; BlackRock and Franklin Templeton. To that end, an examination of the BRRNY, and how it is best replicated, will inform us of how the creation/redemption process is best optimized for over half of the proposed ETFs, and will also provide a strong indication as to how the process is likely to work best for the other proposed spot Bitcoin ETFs that will strike NAV against a different index.
The CME CF Bitcoin Reference Rate - New York Variant (BRRNY)
The CME CF Bitcoin Reference Rate - New York Variant (BRRNY) is a once-a-day benchmark index price for Bitcoin denominated in U.S. dollars that synchronizes with the traditional close of U.S. financial markets. The index is calculated and published every day of the year at 16:00 New York Time and has been since its launch on February 28th, 2022.
CF Benchmarks, the index provider, is authorized by the UK Financial Conduct Authority as a Registered Benchmark Administrator (FRN847100) under the UK Benchmarks Regulation.
Index Methodology
All aspects of the index methodology are publicly available on the CF Benchmarks website: https://docs.cfbenchmarks.com/CME%20CF%20Reference%20Rates%20Methodology.pdf
The BRRNY calculation methodology exclusively aggregates transactions of Bitcoins to U.S. dollars that are conducted on the CME CF Constituent Exchanges. CME CF Constituent Exchanges must meet the CME CF Constituent Exchange Criteria in order to contribute transaction data to the index calculation. The criteria are publicly available and governed by the CME CF Oversight Committee. Conformance with criteria 2 through 5 are reaffirmed on an annual basis.
Since November 22nd, 2022 there have been six CME CF Constituent Exchanges whose transaction data (“Relevant Transactions”) are included in the BRRNY calculation:
Bitstamp
Coinbase
Gemini
ItBit
LMAX Digital
Kraken
The BRRNY is calculated solely utilizing Relevant Transactions of all Constituent Exchanges. Calculation steps on any given Calculation Day are as follows:
- All Relevant Transactions that are executed between 15:00 and 16:00 New York Time are added to a joint list, recording the trade price and size of each transaction
- The list is partitioned into a number of equally-sized, 12 individual time intervals of 5-minute length
- For each of the twelve (12) partitions separately, the volume-weighted median trade price is calculated from the trade prices and sizes of all Relevant Transactions, i.e. across all
- Note that a volume-weighted median differs from a standard median, in that a weighting factor, in this case trade size, is factored into the calculation
Replicating the BRRNY in a pre-funded market structure
The trade execution replication of the CME CF Bitcoin Reference Rate methodology and likely slippage, have been explored in some depth in previous papers (2). However, to understand replication costs more holistically, we need to analyze how a market participant should approach order placement among the CME CF Constituent Exchanges. Note that cryptocurrency exchanges operate a pre-funded model (due to a combination of bitcoin being a bearer asset and settlement being close to instantaneous). Where capital has to be available at the exchange ahead of order placement, inefficient allocation of capital – i.e. placing excessive capital at exchanges that isn't utilized – can be a significant contributor to the overall cost of trading. To understand how best to optimize this capital allocation, we must look beyond trade execution and instead analyze the order books of the six CME CF Constituent Exchanges. In this way, we can understand the probability of achieving an acceptable execution price, and hence how capital should be allocated in anticipation of this.
Measuring Order Book Depth Across CME CF Constituent Exchange
To measure the probability of any given CME CF Constituent Exchange providing an acceptable execution price for replication of the BRRNY, the following analysis of historic order books from all six CME CF Constituent Exchanges was undertaken.
Data Population:
Full order books from all CME CF Constituent Exchanges containing price and size.
Observed at one second intervals, for each and every second during the BRRNY observation window (15:00 to 16:00 New York Time) from October 1st, 2022 to September 30th, 2023, each Calculation Time.
Data Treatment
At each Calculation Time, Relevant Order Books (see below for definition) of each CME CF Constituent Exchange are added to a joint list of order books.
The joint list of order books is aggregated into one consolidated order book.
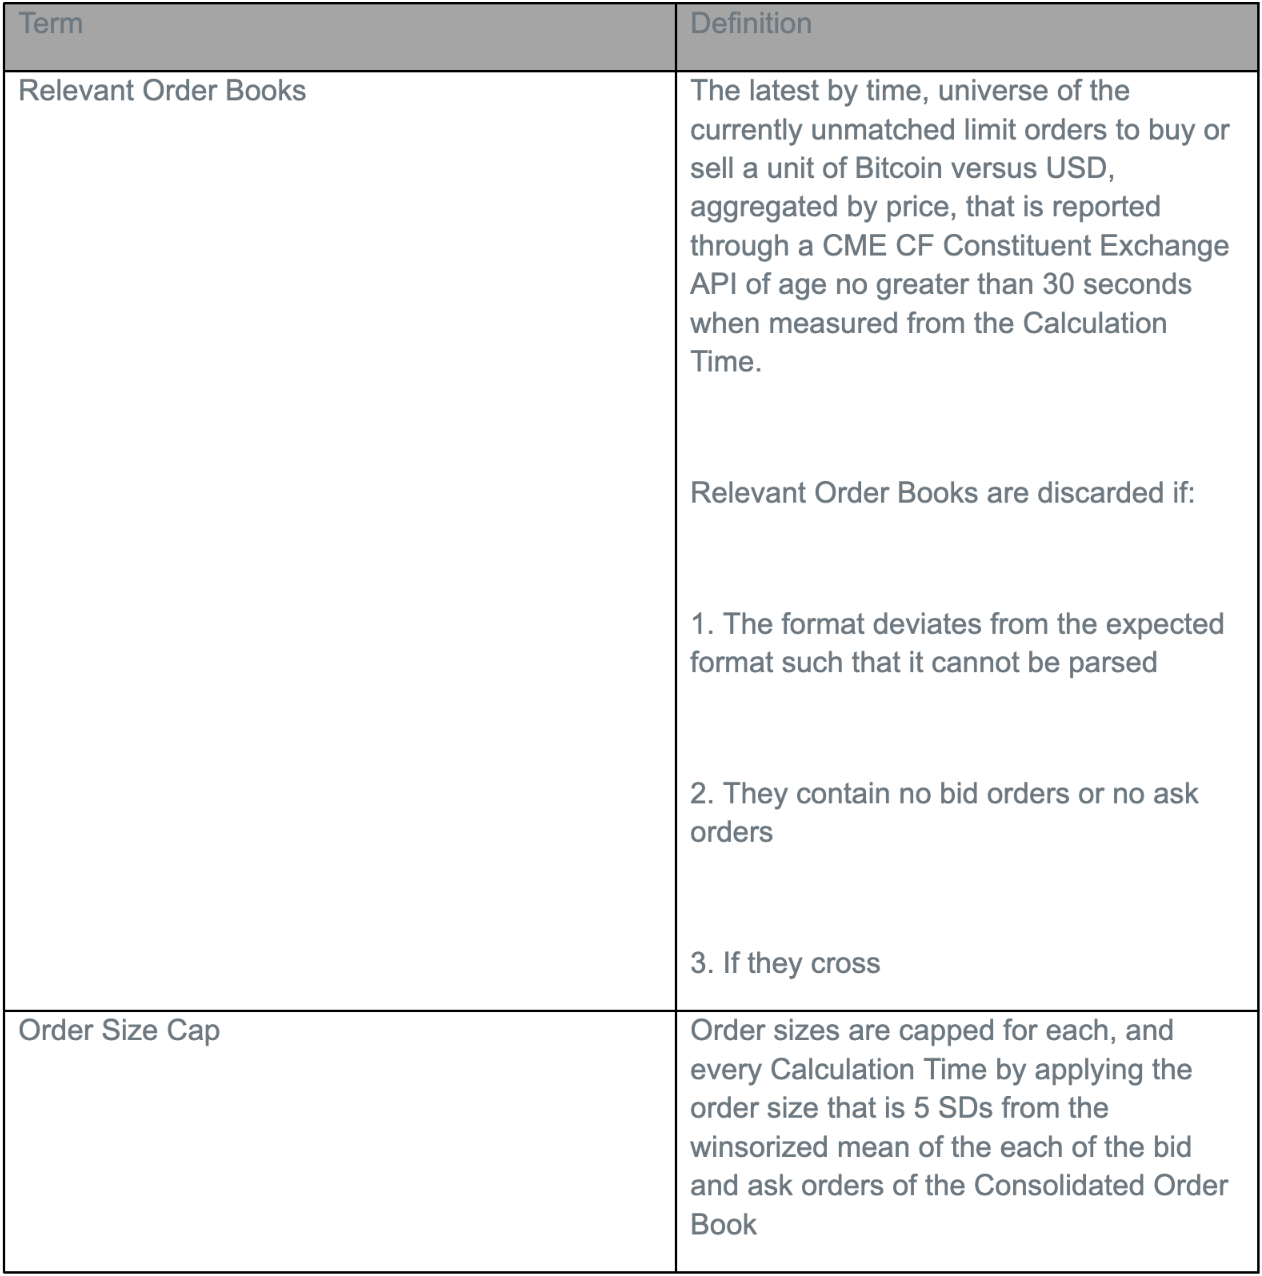
To mitigate against a single outsized order skewing the results, an order size cap (see below for definition) was applied, if the size at the bid or ask order price level exceeds the order size cap, it enters the consolidated order book with a size equal to the order size cap.
The cumulative bid price-volume curve, ask price-volume curve, mid price-volume curve and mid spread-volume curve, are calculated from the consolidated order book at a granularity of 1.
The bid price-volume curve maps transaction volume to the marginal price per cryptocurrency unit that a seller is required to accept in order to sell this volume to the consolidated order book.
The ask price-volume curve maps a transaction volume to the marginal price per cryptocurrency unit a buyer is required to pay in order to purchase this volume from the consolidated order book.
The mid price-volume curve represents the average of the bid price-volume curve and the ask price-volume curve.
The mid spread-volume curve represents the percentage deviation of the ask price-volume curve from the mid price-volume curve.
The utilized depth is calculated as the maximum cumulative volume for which the mid spread-volume curve does not exceed a 0.5% deviation from the mid price. If this volume is less than 1, the utilized depth is set to 1.
The mid price-volume curve is weighted by the normalized probability density of the exponential distribution up to the utilized depth.

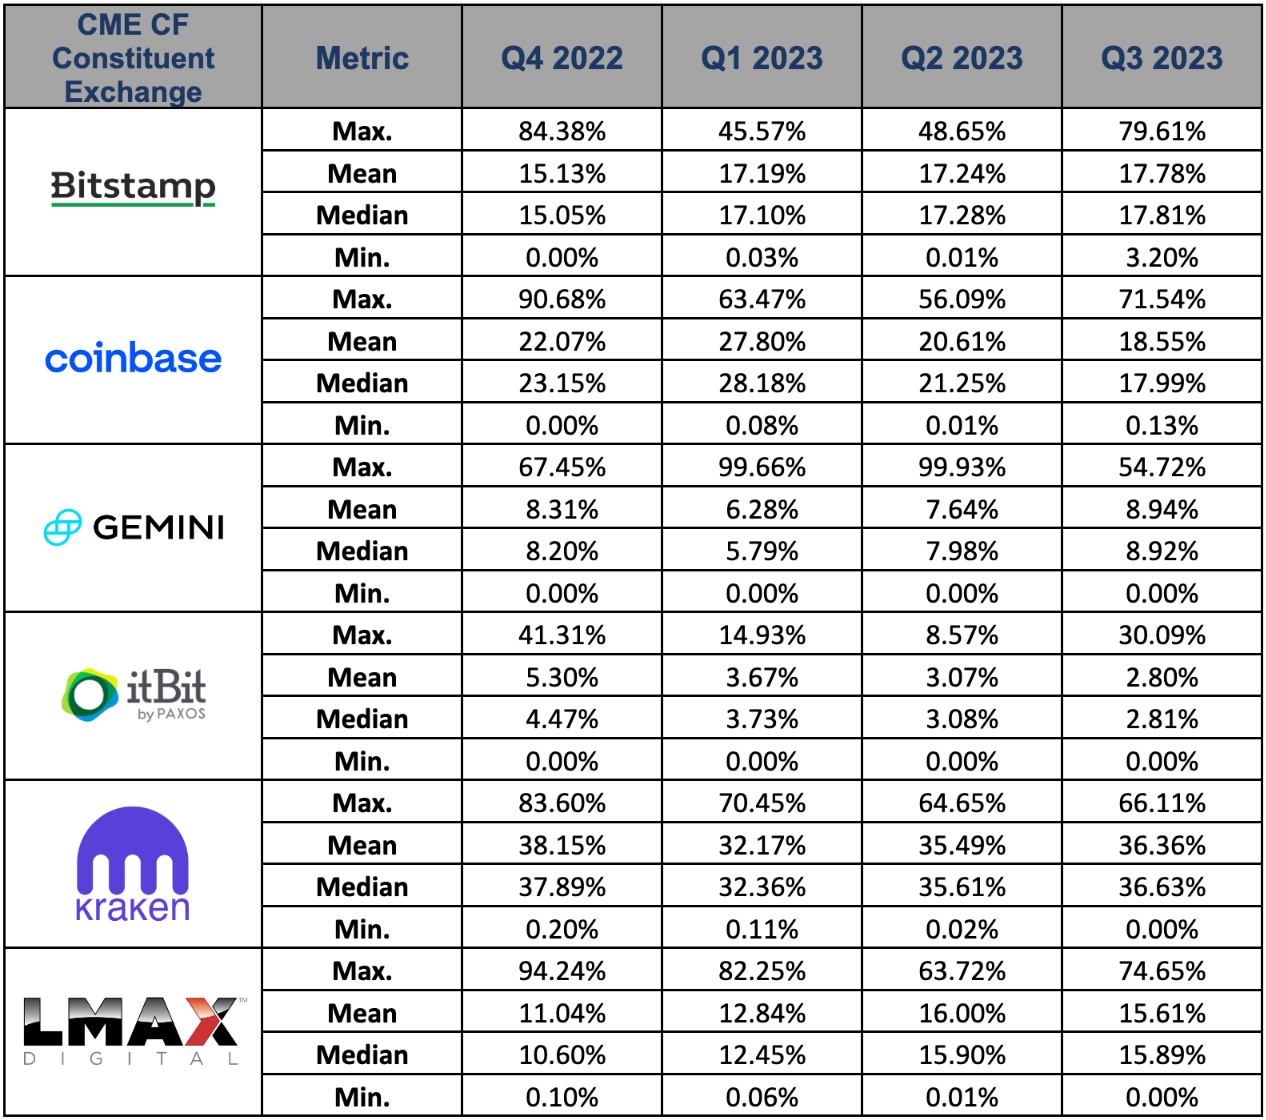
The result of this exercise is that we can ascertain the percentage of the volume within the consolidated order book, up to a 0.5% deviation from the consolidated order book mid, i.e. the orders that are likely to be relevant to a BRRNY replication.
Conducting this analysis for each second within the 15:00 to 16:00 BRRNY observation window in the period from October 1st 2022, to September 30th, 2023, (i.e., 1,314,000 observations) gives us the results summarized below:

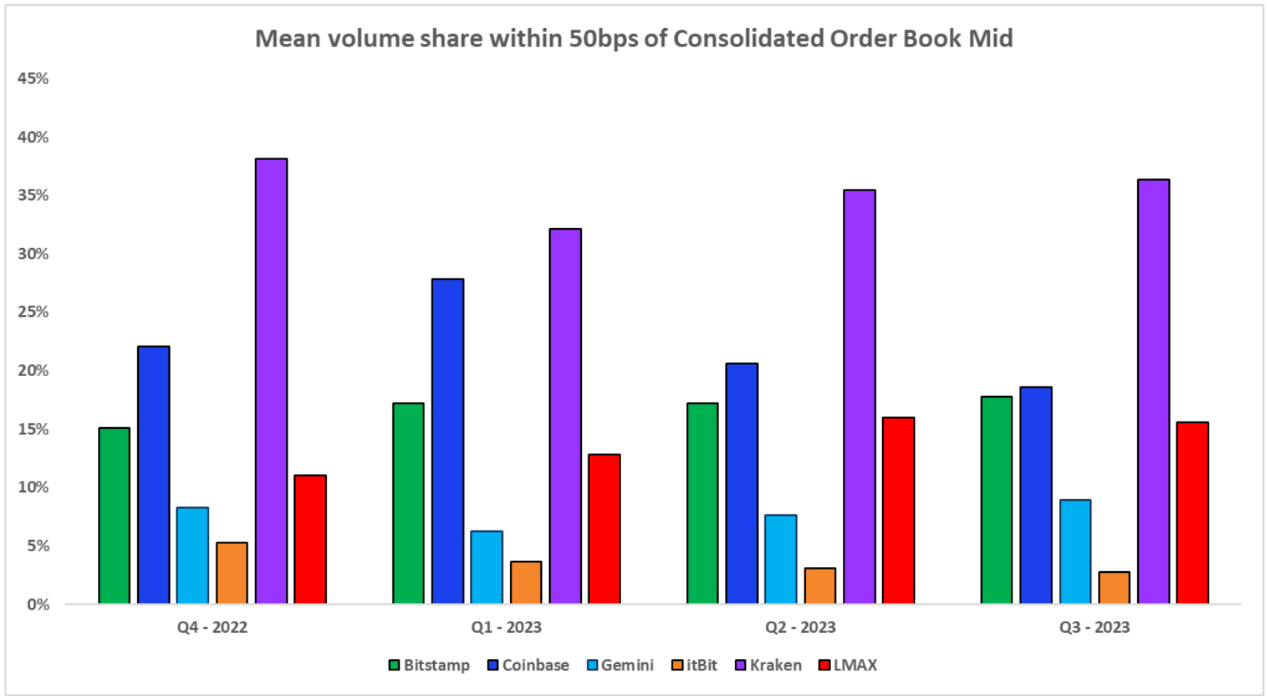
Of the four metrics, the most informative as to how capital should be allocated, should be the mean. As a sanity check on this figure (arithmetic means can be misleading as it's not a given that the data may not conform to a normal distribution) we can cross reference the mean with the median, which shows similar levels, as would be expected in a data population (1.314M) of this size. The mean for all CME CF Constituent Exchanges is displayed graphically:

Conclusion
Whilst the analysis conducted is by no means conclusive as to the exact proportions of capital that should be placed onto each CME CF Constituent Exchange when seeking to replicate the BRRNY, the analysis has only been conducted at one second intervals, and a lot happens on cryptocurrency exchanges in a single second. Furthermore, sophisticated replication strategies that seek to minimize fees through passive order placement and arbitraging prices between exchanges, would necessitate analyzing liquidity in different ways. Nevertheless, it is clear that the difference in liquidity between the six CME CF Constituent Exchanges is significant, and that there are clear efficiencies to be gained by concentrating capital onto a smaller subset of exchanges when executing any replication strategy.
Footnotes
- As of 4th, December 2023. (Bloomberg: <BRRNY> GO)
- Suitability Analysis of the CME CF Bitcoin Reference Rate - New York Variant as a Basis for Regulated Financial Products
Download this paper by clicking below
The information contained within is for educational and informational purposes ONLY. It is not intended nor should it be considered an invitation or inducement to buy or sell any of the underlying instruments cited including but not limited to cryptoassets, financial instruments or any instruments that reference any index provided by CF Benchmarks Ltd. This communication is not intended to persuade or incite you to buy or sell security or securities noted within. Any commentary provided is the opinion of the author and should not be considered a personalised recommendation. Please contact your financial adviser or professional before making an investment decision.
Note: Some of the underlying instruments cited within this material may be restricted to certain customer categories in certain jurisdictions.

CF Benchmarks

CF Benchmarks


