
Jun 14, 2024
Suitability Analysis of the CME CF Solana-Dollar Reference Rate as a Basis for Regulated Financial Products
Benchmarking the Price of Solana
The short history and rapid growth of Solana
The Solana blockchain has evolved rapidly since being proposed in a whitepaper by developer Anatoly Yakovenko in 2017, followed by its relatively recent launch in 2020. Since then, it has showcased a diverse set of use cases, and significant technological advancements.
Solana's raison d'être largely grew from the search by the crypto community for a network possessed of facilities similar to those of the Ethereum blockchain, but which would be purposely designed from the ground up to avoid certain persistent issues faced by Ethereum; chiefly the challenges of improving throughput, and reducing transaction costs.
Solana's relatively fast transaction speed was recognized early on as a key advantage, and the network has demonstrated a quantifiably more rapid throughput to date. A May 2024 comparison of several blockchains' average transactions per second (TPS) ranked Solana the fastest at 1,053.7, with Ethereum sharply underperforming at 22.7 TPS.1
Solana quickly attracted decentralized finance (DeFi) applications aiming to provide scalable and efficient financial services. In December 2023, Circle's EURC stablecoin debuted on Solana, further solidifying its position as a preeminent DeFi chain.
A top 5 blockchain
At the time of writing in June 2024, the network was ranked by data aggregator DefiLlama as 4th in terms of Total Value Locked (TVL), the metric used to determine the total U.S. dollar value of digital assets locked, or staked, on a blockchain network via DeFi platforms or decentralized applications (DApps). Solana's TVL figure stood at around $4.4bn. For comparison, the next blockchain down by TVL was Arbitrum, with about $3bn locked.
There were 1.28 million active addresses on the Solana blockchain, ranking Solana 3rd by that measure, compared to TRON at number two, with 2.2 million active addresses.
Solana also ranks as a top 5 blockchain in terms of market value. At the time of writing, the network's native token SOL was the 3rd largest asset by free float market capitalization within CF Benchmarks' CF Cryptocurrency Ultra Cap 5 index (CFUC5). CFUC5 is an investible benchmark index tracking the performance of a free float market capitalization weighted portfolio of the 5 largest cryptocurrencies. SOL was weighted at approximately 5.3%, above XRP, ranked 4th, with a weighting of about 1.4%.
Institutional participation
Institutional interest and participation in SOL has increased almost in step with the rise of activity on its blockchain and the value locked within it. The first Solana exchange traded product (ETP) was launched by 21Shares in 2021, followed by another from WisdomTree Europe in 2022.
Benchmarking SOL
The likelihood that institutional participation in Solana will continue to increase underscores the need for price benchmarks that are demonstrably fit for the purpose of pricing this growing asset. Whilst Solana is a relatively novel cryptoasset, the characteristics and standards required of it by institutions are no different from those required of a benchmark price for any other asset.
For a pricing source to be utilised by regulated institutions as the benchmark for regulated products, it must fulfil what CF Benchmarks has referred to as the 'Three Rs', three essential prerequisites that determine its suitability for this role. These pillars also determine whether or not a price source meets the standards required of pricing benchmarks as defined by the Benchmarks Regulation (BMR) framework2: the benchmark must be representative of the underlying market, resistant to manipulation, and replicable by market participants.
The CME CF Solana-Dollar Reference Rate
This paper seeks to understand whether these qualities are achieved by CF Benchmarks' CME CF Solana-Dollar Reference Rate (SOLUSD_RR). The CME CF Solana-Dollar Reference Rate is a once-a-day benchmark index price for Solana denominated in U.S. dollars. Input data are obtained from major cryptocurrency exchanges that conform to the CME CF Constituent Exchange Criteria. Calculated every day since its launch on April 25th, 2022, SOLUSD_RR is a regulated benchmark under the UK Benchmarks Regulation (BMR) regime. Notably, the index is used by several institutional market participants, including issuers of exchange traded products (ETPs), for which it serves as the price for NAV calculation, as well as being utilised by liquidity providers as the reference price for OTC products.
Calculation Methodology
The SOLUSD_RR calculation methodology aggregates transactions of Solana in U.S. dollars conducted only on the most liquid markets for which data are publicly available and operated by exchanges that meet the CME CF Constituent Exchange Criteria.
The list of Constituent Exchanges and information about changes to its composition are available at the following URL:
https://docs.cfbenchmarks.com/CME%20CF%20Constituent%20Exchanges%20Criteria.pdf
The full methodology is also available here:
https://docs.cfbenchmarks.com/CME%20CF%20Reference%20Rates%20Methodology.pdf
The methodology can be summarised thus:
- Transactions conducted on Constituent Exchanges are observed during a one-hour window from 15:00 to 16:00 London Time
- The one-hour window is divided into 12 partitions of equal length (five minutes each)
- For each partition, a volume-weighted median (VWM) is calculated
- The index value is expressed as the arithmetic mean of the 12 VWMs calculated in the previous step
Suitability of 16:00 London Time for calculation
The graph in Figure 1 illustrates the rationale of calculating the CME CF Solana-Dollar Reference at 16:00 London Time. For the data set illustrated, Solana-U.S. dollar transaction volumes on Constituent Exchanges were measured over an observation period of May 1st, 2022, to April 30th, 2024.
Figure 1
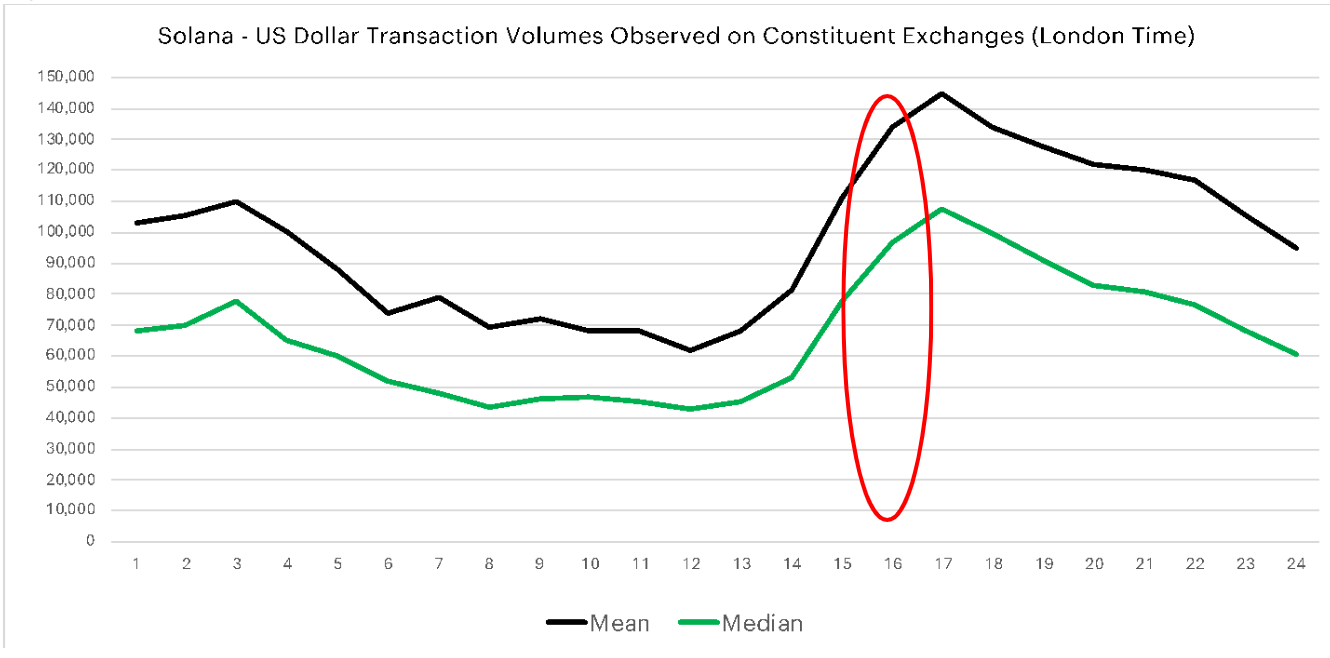
Unlike most traditional assets, Solana can be traded at any time of the day. But the trading data shown in the above graph clearly indicates that Solana market participation volume adheres quite closely to times when traditional markets tend to experience their own high trading volumes.
One of the most liquid times of the day for Constituent Exchange volumes, together with the typical 4pm traditional market closing time of several large European cities, points to an optimal time of 15:00 to 16:00 London Time to measure transactions for a daily benchmark price of Solana.
Benchmark validity and volume sufficiency
A valid and robust benchmark needs to be calculated from input data of sufficient volume so that it is representative of the market it seeks to measure. From a practical perspective, volume sufficiency is also key in order for the benchmark to be replicated by institutional market participants and product providers that need to warehouse price risk. To understand how SOLUSD_RR measures up, data summarising an average number of Solana and an average U.S. dollar value per day, observed each month during the observation window, are presented in Figure 2.
Figure 2
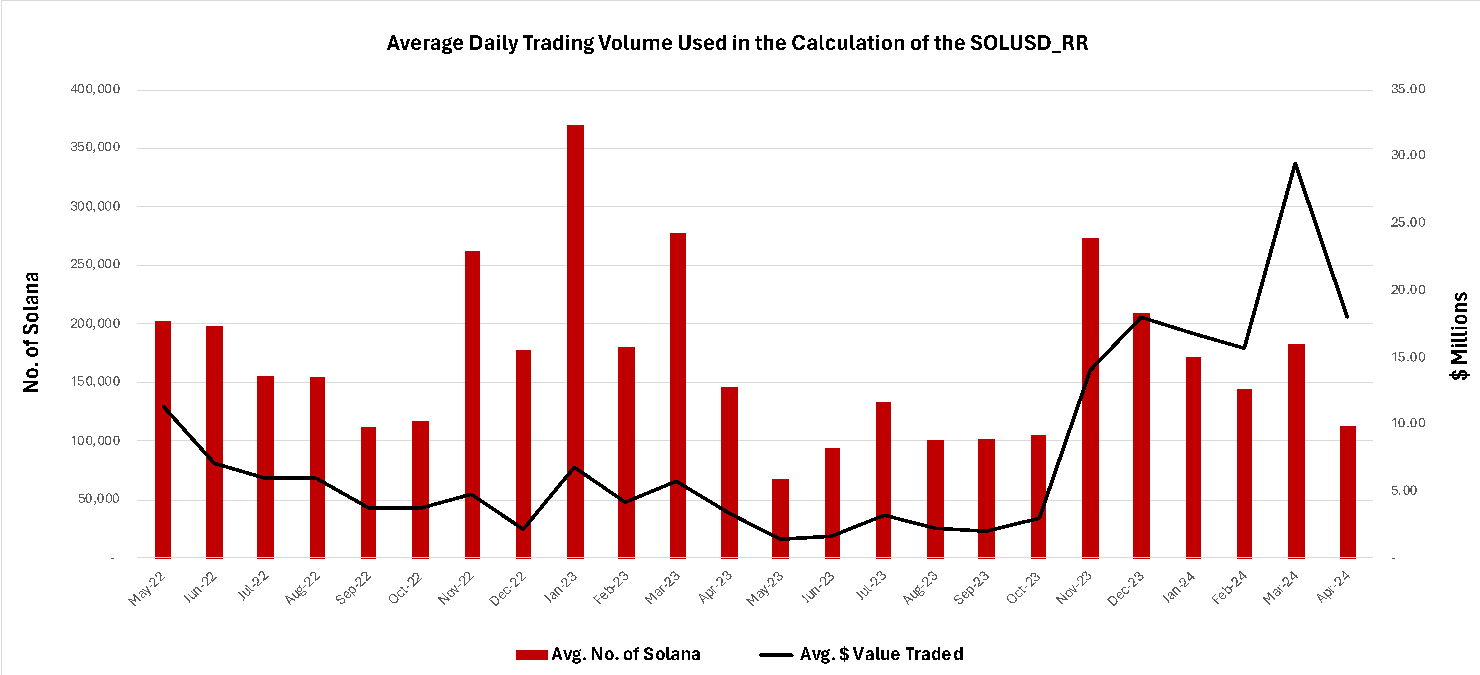
Note: Gemini was included as a Constituent Exchange from November 2022
As can be seen, between May 1st, 2022, and April 30th, 2024, on average, 169,226.46 Solana, or $7.9M (at contemporaneous USD prices) were traded across an average of 7,037 transactions during each daily observation window, between 15:00 and 16:00 London Time, on the SOL-USD markets of CME CF Constituent Exchanges used as input data to SOLUSD_RR. Whilst trading activity exhibits volatility, this volatility is not substantially different from that shown in traditional asset markets. The volume observed and the reliability of that volume are clearly evident to be sufficient for the calculation of a robust and reliable benchmark.
Resistance to Manipulation – Benchmark Integrity
This section will address the question of whether the CME CF Solana-Dollar Reference Rate is possessed of integrity in the specific sense applied by securities regulation. The practical imperative is that a benchmark requires integrity because it will be used for a wide range of activities such as asset valuation, settlement of financial risk, risk management, NAV calculation, unit creation and unit redemption. Specifically, the benchmark must both be shown to be free of manipulation, and furthermore, it must be administered and calculated in a manner that deters and impedes manipulation.
Deterring and Impeding Manipulation
The methodological design underlying the CME CF Solana-Dollar Reference Rate and its system of administration incorporate measures that promote integrity as outlined in the sub-sections below.
Impeding Manipulation by Input Data selection
CF Benchmarks sources input data exclusively from Constituent Exchanges that meet published criteria as set out in its Constituent Exchanges Criteria. The criteria are available at this link:
https://docs.cfbenchmarks.com/CME%20CF%20Constituent%20Exchanges%20Criteria.pdf.
Particular attention is drawn to the following statement from the Constituent Exchanges Criteria document (part 2 of Section 3, page 5: ‘Eligibility Criteria’):
“The venue has policies to ensure fair and transparent market conditions at all times and has processes in place to identify and impede illegal, unfair or manipulative trading practices.”
CF Benchmarks ascertains the presence of fair and transparent market conditions and processes to identify and impede illegal, unfair or manipulative practices by conducting a thorough review of any exchange under consideration for inclusion as a Constituent Exchange. The arrangements of all Constituent Exchanges are reviewed annually to ensure that they continue to meet all criteria specified within “Constituent Exchange Criteria”. This due diligence is documented, and the information is distributed to CF Benchmarks’ oversight organs to consider. The deliberations of oversight organs are conducted during regular meetings, minutes of such meetings are publicly available, being published by the Administrator on its website.
Manipulation resistance by design
Resistance to manipulation is a priority aim of the design methodology underlying the CME CF Solana-Dollar Reference Rate. The methodology takes an observation period and divides it into equal partitions of time. The volume-weighted median of all transactions within each partition is then calculated. The benchmark index value is determined from the arithmetic mean of the volume-weighted medians, equally weighted. The benefits of this process with respect to achieving manipulation resistance are outlined below.
- Use of partitions
Individual trades of large size have limited effect on the index level as they only influence the level of the volume-weighted median for that specific partition.
A cluster of trades in a short period of time will also only influence the volume-weighted median of the partition or partitions they were conducted in.
- Use of volume-weighted medians
Use of volume-weighted medians as opposed to volume-weighted means ensures that transactions conducted at outlying prices do not have an undue effect on the value of a specific partition.
- Equal weighting of partitions
By not volume weighting partitions, trades of large size or clusters of trades over a short period of time will not have an undue influence on the index level.
- Equal weighting of constituent exchanges
CF Benchmarks applies equal weight to transactions observed from CME CF Constituent Exchanges. With no pre-set weights, potential manipulators cannot target one platform for the conduct of manipulative trades.
- Use of arithmetic mean of partitions
Using the arithmetic mean of partitions of equal weight further denudes the effect of trades of large size at prices that deviate from the prevailing price having undue influence on the benchmark level.
Manipulation resistance by exclusion of input data.
A specific procedure for dealing with potentially erroneous data is incorporated into the methodology of the CME CF SOLUSD_RR. Although volume-weighted medians of transaction prices from individual data sources are not part of the benchmark determination process, they are calculated as a means of quality control and manipulation resistance.
In the event of an instance of index calculation in which a Constituent Exchange’s volume-weighted median transaction price exhibits an absolute percentage deviation from the volume-weighted median price of other Constituent Exchange transactions greater than the potentially erroneous data parameter (10%), then transactions from that Constituent Exchange are deemed potentially erroneous and excluded from the index calculation. All instances of data excluded from a calculation trigger a Benchmark Surveillance Alert that is investigated.
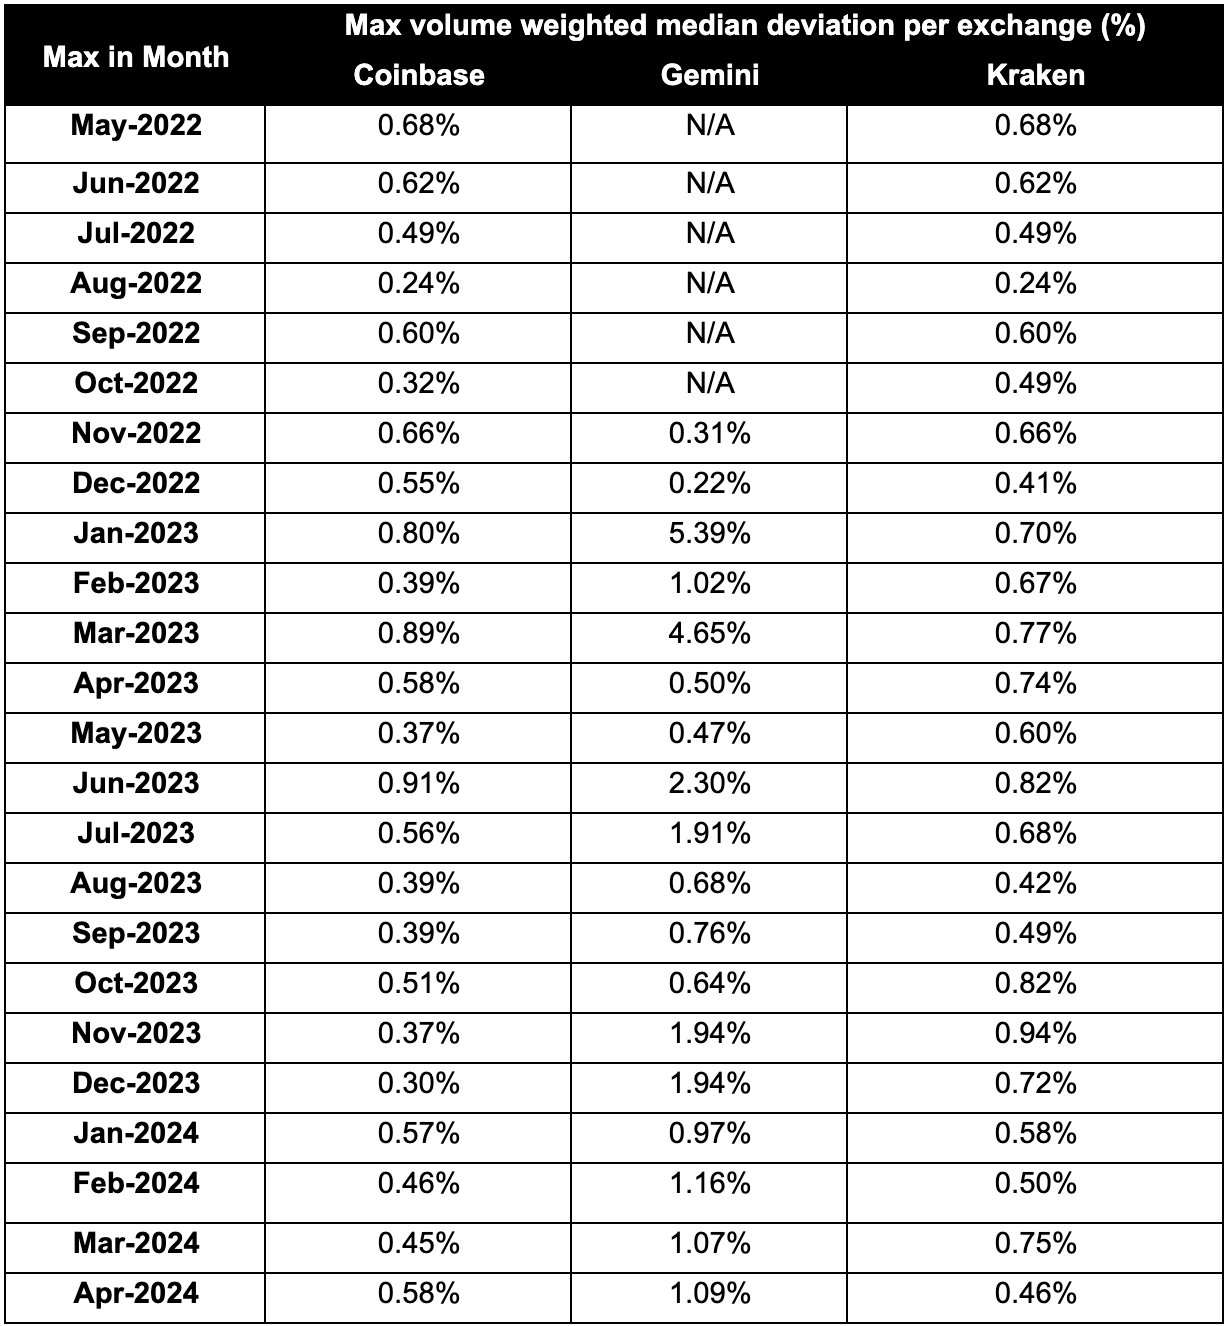
Between May 1st, 2022, to April 30th, 2024, the potentially erroneous data parameter of the methodology for the CME CF Solana-Dollar Reference Rate has never been triggered. Analysis of the MAX volume-weighted median per exchange during the observation period produced the results in Table 1. The results illustrate that during the observation period, no Constituent Exchange’s input data needed to be excluded due to exhibiting potential manipulation and indeed no individual cryptocurrency exchange exhibits a deviation percentage above 5.39% during this period.
Table 1
Benchmark Surveillance
Although a series of measures have been undertaken to mitigate the risk of benchmark manipulation, CF Benchmarks remains vigilant against attempted benchmark manipulation and monitors input data continuously. To that end, CF Benchmarks has implemented a benchmark surveillance programme for the investigation of alerts. Instances of suspected benchmark manipulation are escalated through appropriate regulatory channels in accordance with CF Benchmarks’ obligations under the UK Benchmarks Regulation (UK BMR). Regarding benchmark manipulation, Article 14 of the UK BMR, Reporting of Infringements, states:
- An administrator shall establish adequate systems and effective controls to ensure the integrity of input data in order to be able to identify and report to the competent authority any conduct that may involve manipulation or attempted manipulation of a benchmark, under Regulation (EU) No 596/2014.
- An administrator shall monitor input data and contributors in order to be able to notify the competent authority and provide all relevant information where the administrator suspects that, in relation to a benchmark, any conduct has taken place that may involve manipulation or attempted manipulation of the benchmark, under Regulation (EU) No 596/2014, including collusion to do so.”
As a regulated Benchmark Administrator, CF Benchmarks is subject to supervision by the UK FCA. Furthermore, CF Benchmarks’ Control Procedures with respect to compliance with the UK BMR have been audited by ‘Big Four’ accountancy firm Deloitte. The Independent Assurance Report on Control Procedures Noted by CF Benchmarks Regarding Compliance with the UK Benchmarks Regulation as of 12 September 2022 is available at the following link:
https://docs.cfbenchmarks.com/Deloitte_CF%20Benchmarks%20SOC1%20Audit%20Report.pdf
This further verification of CF Benchmarks’ compliance with the UK BMR places the CME CF Solana-Dollar Reference Rate on the same level of scrutiny applied to widely used traditional financial benchmarks like ICE SWAP, SONIA and RONIA.
Assessing CME CF SOLUSD_RR values and input data for signs of manipulation
Whilst the CME CF SOLUSD_RR was designed and is administered to the highest standards, including efforts to uphold provisions of the UK BMR, the proof of the pudding is in the eating and further analysis of the data is required.
Were there to be a lack of integrity in the input data that could in turn affect the integrity of the benchmark, one would expect to see one of a number of phenomena reflected in the input data provided by Constituent Exchanges. One potential example would be significant price dislocations between Constituent Exchanges.
How well correlated are Constituent Exchange prices?
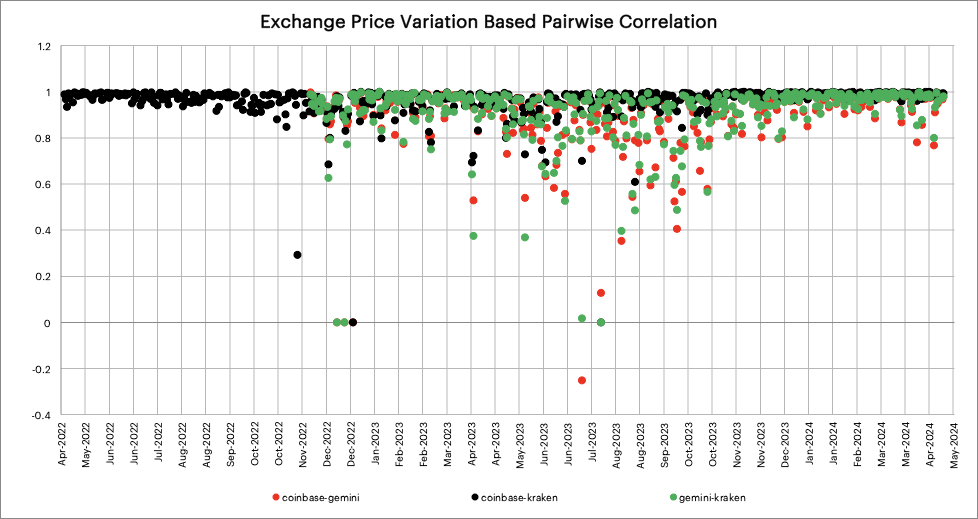
An analysis was undertaken of the pairwise correlation of prices from Constituent Exchanges on a per-minute basis (the price difference between transactions for each minute at each exchange) during the observation period. The results of this analysis are shown in Table 2.
Table 2
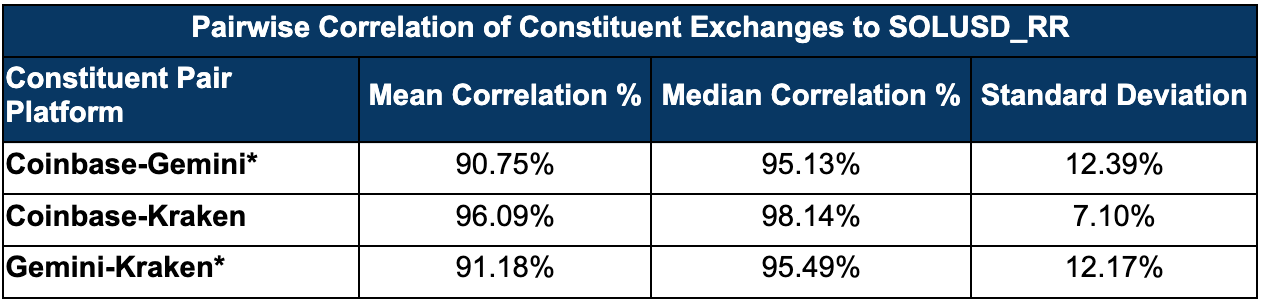
*Gemini became a constituent exchange from November 22nd, 2022
To illustrate the data analysed in Table 2 in graphical form, Figure 3 (below) displays the full data set. The clustering towards correlation coefficients of 1.00 and the fact that on less than 2.39% of days did any exchange have a correlation with another exchange below 0.5 demonstrate strong price correlation between the Constituent Exchanges and point towards fair and orderly markets. The pattern is understandably broken around the time of the FTX bankruptcy (November-December 2022) given the extreme volatility this event precipitated.
Replicability and Implementation
The final characteristic of the SOLUSD_RR that this paper will examine with respect to its merits as a benchmark price is its replicability. In other words, that the SOLUSD_RR benchmark price can be transacted in practice on any given day without undue risks.
Buying and selling large amounts of Solana at SOLUSD_RR
To begin demonstrating the replicability—or to use another term, the achievability—of the strategy presented in this paper for purchasing Solana ‘at scale’, observations taken whilst modelling the purchase or sale of a notional large amount of Solana are presented below. It was decided that the purchase or sale of 12,664 Solana (c. $2.08M at prevailing prices) was at an adequate scale to represent a large Solana trade of the kind that institutional traders might need to undertake for a client, or that an issuer of a financial product (such as an ETF or a derivative) would be required to execute on any given day, in order to facilitate trading of that product. A simple replication simulation was thereby conducted to demonstrate the extent of slippage that implementation of the SOLUSD_RR would probably encounter. Given the purpose is to demonstrate institutionally sized liquidity, the simulation was conducted for weekdays only.
Simulation Methodology
- Trades are executed on n (5) Constituent Exchanges, during a 3,600-second window
- One trade is executed every second and the price achieved is assumed to be the last execution price observed in that second. Its associated volume is assumed to be the volume executed during that second
- If no trade is completed in any single-second period, then the price achieved is assumed to be the price achieved in the previous second, but the associated volume from the previous second is not added to the volume executed in the latest second
It is worth noting that in the ‘real world’, institutions deploy algorithmic systems to execute large-scale asset purchases. It is highly probable that conducting the exercise presented here by means of algorithmic systems would have produced outcomes that are even more favourable. For research purposes, a simplified simulation methodology was favoured to demonstrate the replicability properties of SOLUSD_RR.
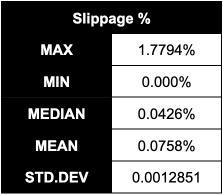
The results of this exercise are displayed in Figure 4 and summary data provided in Table 3. As can be seen, SOLUSD_RR can be replicated with a high degree of confidence and usually with slippage, in most cases, below 10 basis points. Indeed, even on the most volatile of days, slippage was only 177 basis points.
Figure 4
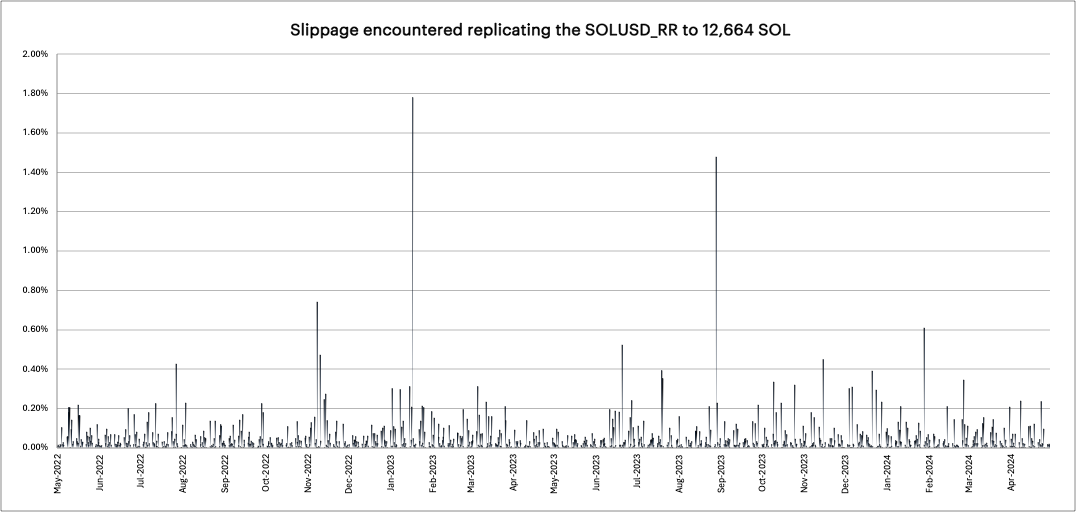
Table 3
Conclusion
From the analysis conducted it is quite clear that the CME CF Solana-Dollar Reference Rate exhibits all the key properties required of a benchmark.
Representative: Solana-USD markets that are operated by the CME CF Constituent Exchanges during 15:00 to 16:00 London Time are liquid, with sufficient volume of trading to represent the market in a robust manner.
Resistant to Manipulation: Its Constituent Exchange Criteria ensures that it takes input data only from cryptocurrency exchanges that exhibit fair and orderly behaviour, where trading shows strong price correlations among each other. On top of this, the methodology the SOLUSD_RR employs nullifies effects of any manipulation, and the Administrator’s policies and processes regarding surveillance ensure that any manipulation is detected.
Replicable: Its methodology promotes replicability, allowing users to replicate the benchmark simply and without undue risks.
References
- Lim, Yu Qian. 2024. “The Fastest Blockchain Processed 91M Transactions in a Day” - CoinGecko
- Norton Rose Fulbright. 2020. “Benchmarks: EU and UK regulatory outlook”
The information contained within is for educational and informational purposes ONLY. It is not intended nor should it be considered an invitation or inducement to buy or sell any of the underlying instruments cited including but not limited to cryptoassets, financial instruments or any instruments that reference any index provided by CF Benchmarks Ltd. This communication is not intended to persuade or incite you to buy or sell security or securities noted within. Any commentary provided is the opinion of the author and should not be considered a personalised recommendation. Please contact your financial adviser or professional before making an investment decision.
Note: Some of the underlying instruments cited within this material may be restricted to certain customer categories in certain jurisdictions.


Ken Odeluga

CF Benchmarks

Gabriel Selby