Jan 07, 2025
Weekly Index Highlights, January 6, 2025
Market Performance Update
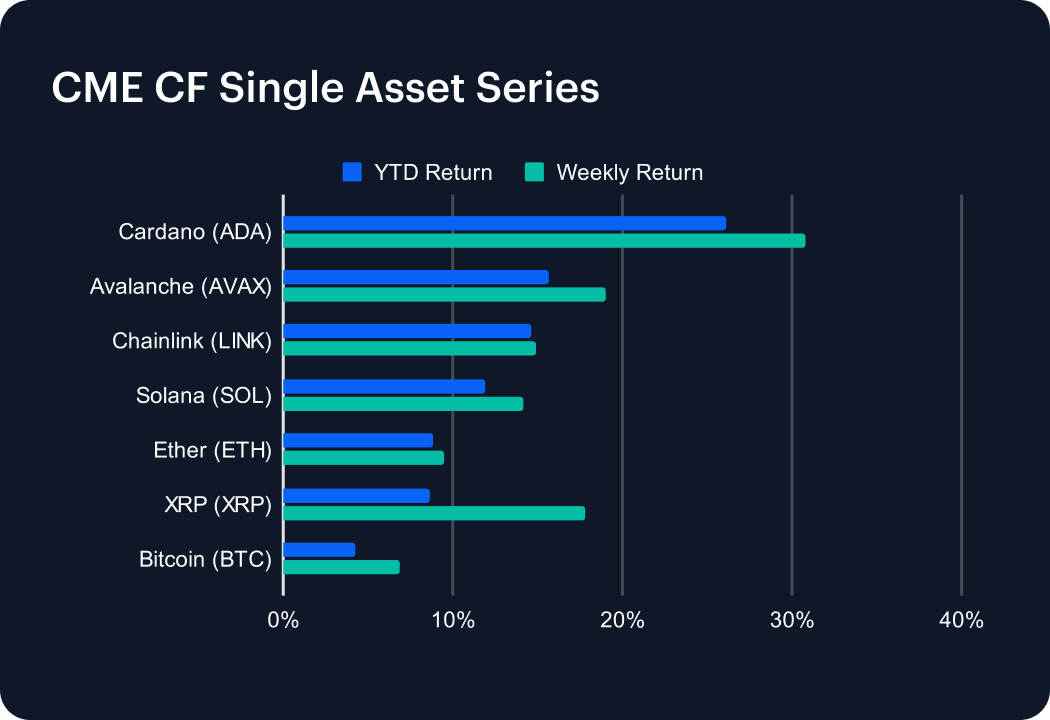
A broad-based rally across digital assets marked the first trading days of 2025, with all CME CF Single Asset indices advancing significantly. Cardano (ADA) emerged as the standout performer, surging +30.82% weekly and leading year-to-date (YTD) returns at +26.13%. Avalanche (AVAX) and Chainlink (LINK) demonstrated robust momentum, posting weekly gains of +19.02% and +14.92% respectively, translating to YTD returns of +15.66% and +14.63%. XRP outpaced market bellwether Bitcoin, advancing +17.81% for the week while BTC recorded a more modest +6.87% gain. The current market structure positions Solana (SOL) in fourth place YTD at +11.95%, followed by Ether (ETH) at +8.79%. Bitcoin, despite its recent appreciation, currently shows the most conservative YTD performance at +4.22%, suggesting a potential early rotation into altcoins.
Sector Analysis
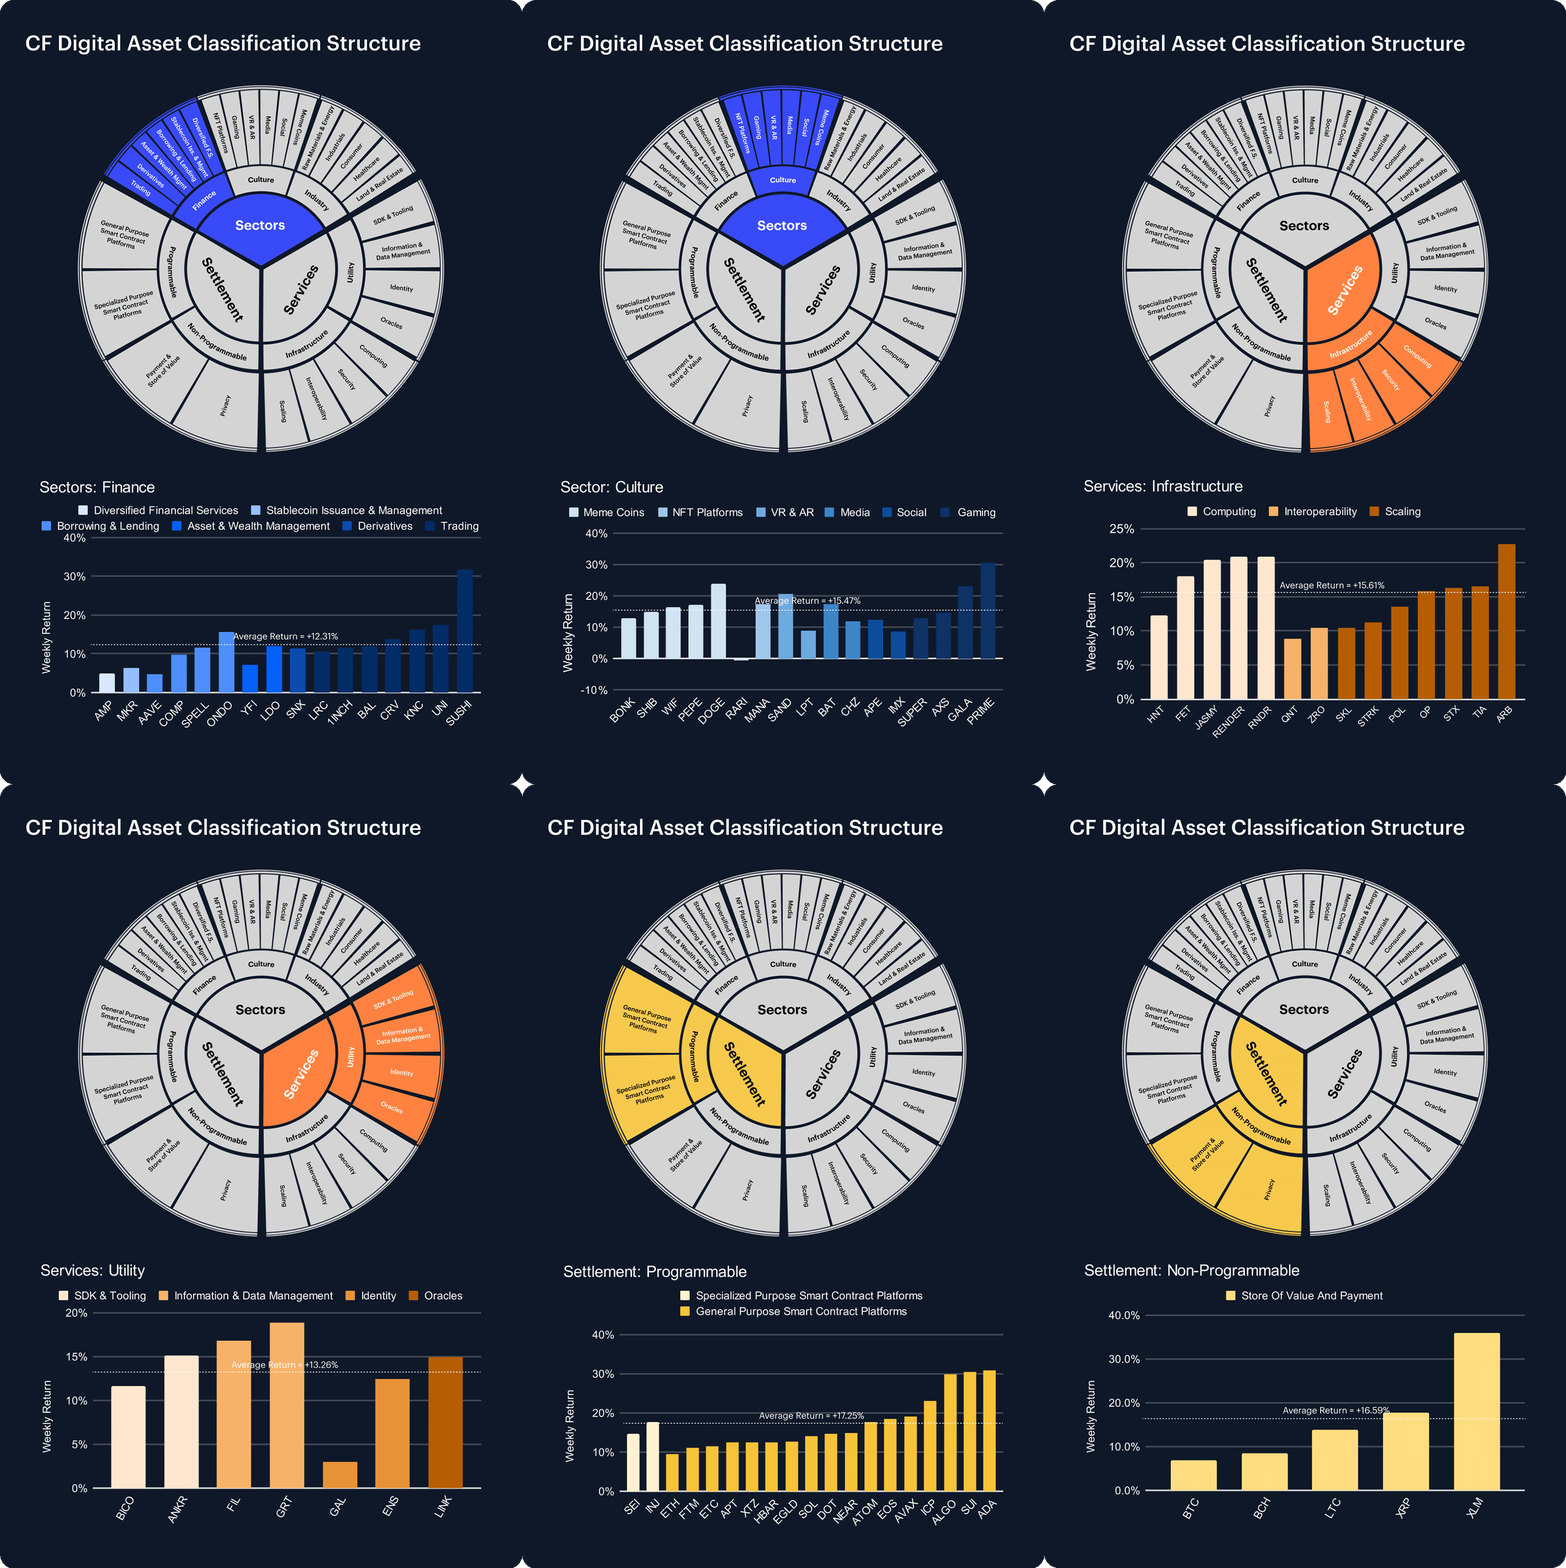
All CF DACS segments demonstrated robust positive momentum in the first trading days of the year, with particularly strong performance across Settlement protocols. Within the Non-programmable sub-category, Stellar (XLM) led with an exceptional +35.89% gain, driving the segment's +16.59% average return. The Programmable sub-category averaged +17.25%, buoyed by Cardano (ADA) and SUI's matching +30% advances. Infrastructure tokens posted a +15.61% average gain, with Layer-2 scaling solutions like Arbitrum (ARB) leading at +22.76%. The Utility sub-category averaged +13.26%, supported by Information & Data Management tokens GRT (+18.84%) and FIL (+16.78%). Culture tokens showed varied performance, with Gaming segment outperforming as PRIME and GALA surged +30.54% and +23.14% respectively. Finance protocols averaged +12.31%, led by SUSHI's +31.73% rally in the Trading segment.
Staking Metrics
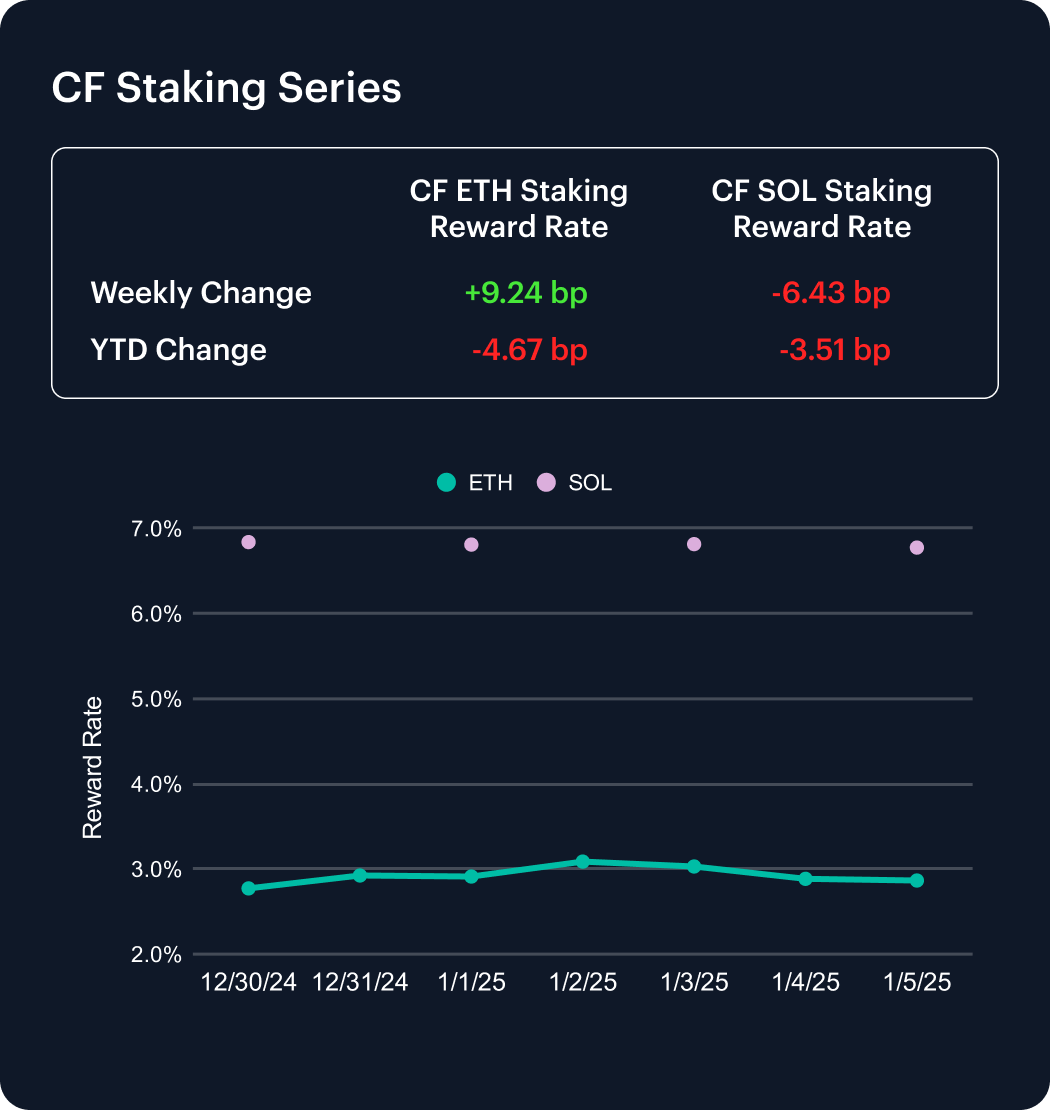
The CF Ether Staking Reward Rate Index (ETH_SRR) increased by +9.24 basis points over the past week, settling at 2.86% annual rate. The index exhibited notable intraweek volatility, peaking at 3.09% before moderating. Despite this weekly strength, ETH staking yields remain slightly compressed on a year-to-date basis, down -5.91basis points.
The CF SOL Staking Reward Rate Index (SOL_SRR) moved in the opposite direction, declining -6.43 basis points to settle at 6.77%. This represents a -0.94% weekly decline and positions the index down -3.51 basis points year-to-date. The divergent performance between ETH and SOL staking yields suggests evolving dynamics in the validator economics of major proof-of-stake networks as 2025 begins.
Market Cap Index Performance
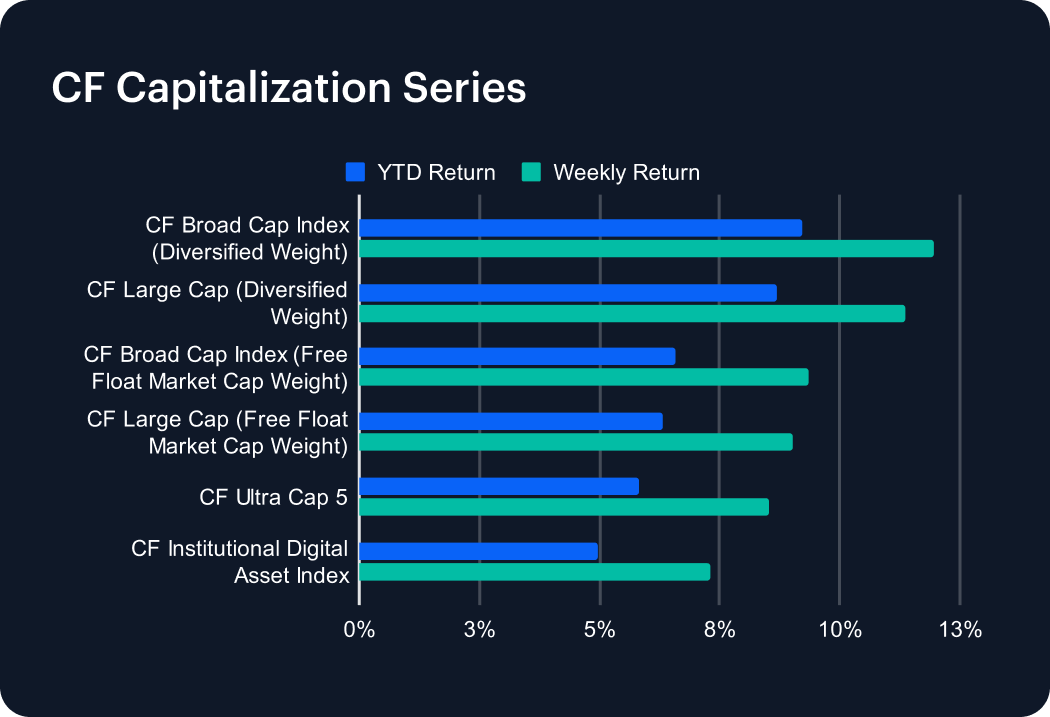
Our CF Capitalization indices showcased strong price appreciation to start the year, with diversified weightings significantly outperforming their free float counterparts. The CF Broad Cap Index (Diversified Weight) led the advance, posting an +11.97% weekly gain and securing the strongest year-to-date position at +9.20%. This outperformance indicates heightened risk appetite favoring mid-to-small capitalization assets.
The trend towards diversified exposure is further evidenced by the CF Large Cap (Diversified Weight) gaining +11.37% for the week, while the more concentrated CF Ultra Cap 5 and CF Institutional Digital Asset Index showed more modest advances of +8.54% and +7.32% respectively. The performance disparity between diversified and market cap-weighted methodologies suggests a broader market rotation into alternative digital assets, with the CF Institutional Digital Asset Index currently showing the most conservative year-to-date return at +4.97%.
Classification Series Analysis
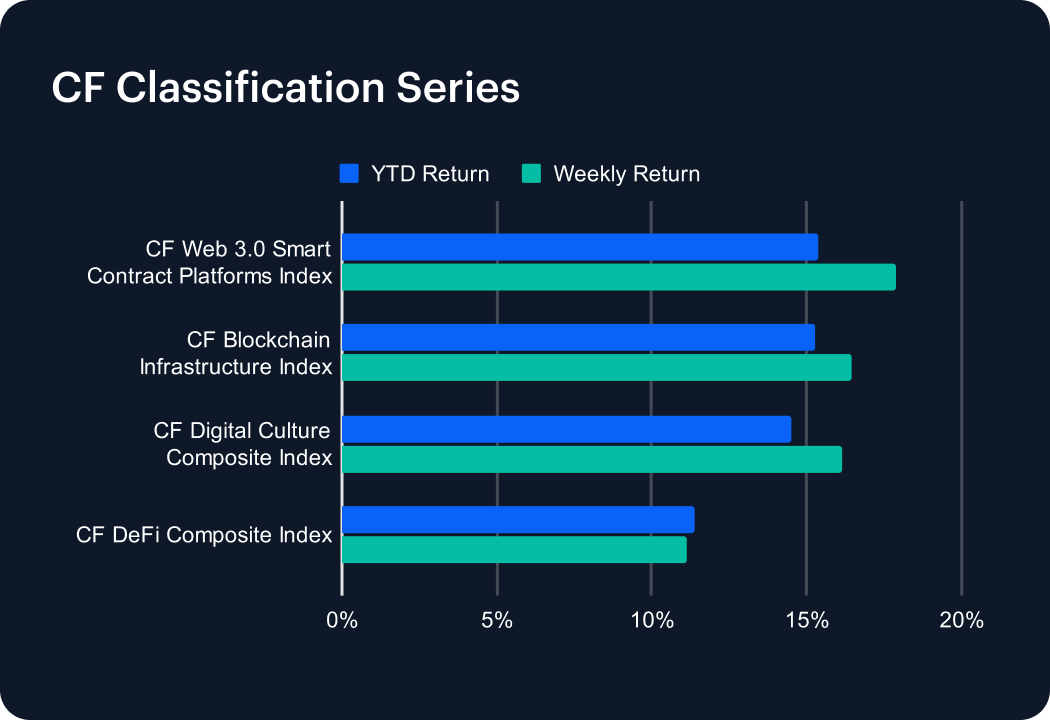
The CF Classification Series indices also demonstrated robust new-year momentum, with the CF Web 3.0 Smart Contract Platforms Index leading performance at +17.90% weekly and +15.38% year-to-date. Infrastructure protocols showed similar strength, with the CF Blockchain Infrastructure Index advancing +16.44% for the week, securing a +15.29% YTD position.
The CF Digital Culture Composite Index maintained the broader positive trend, rising +16.15% weekly and registering a +14.51% YTD return. While the CF DeFi Composite Index posted the most modest gains at +11.11% weekly and +11.38% YTD, the synchronized double-digit appreciation across all sector benchmarks reflects strengthening institutional confidence in specialized digital asset verticals. The market’s recent performance highlights growing excitement around foundational blockchain technology and smart contract platforms as we kick off 2025.
Volatility
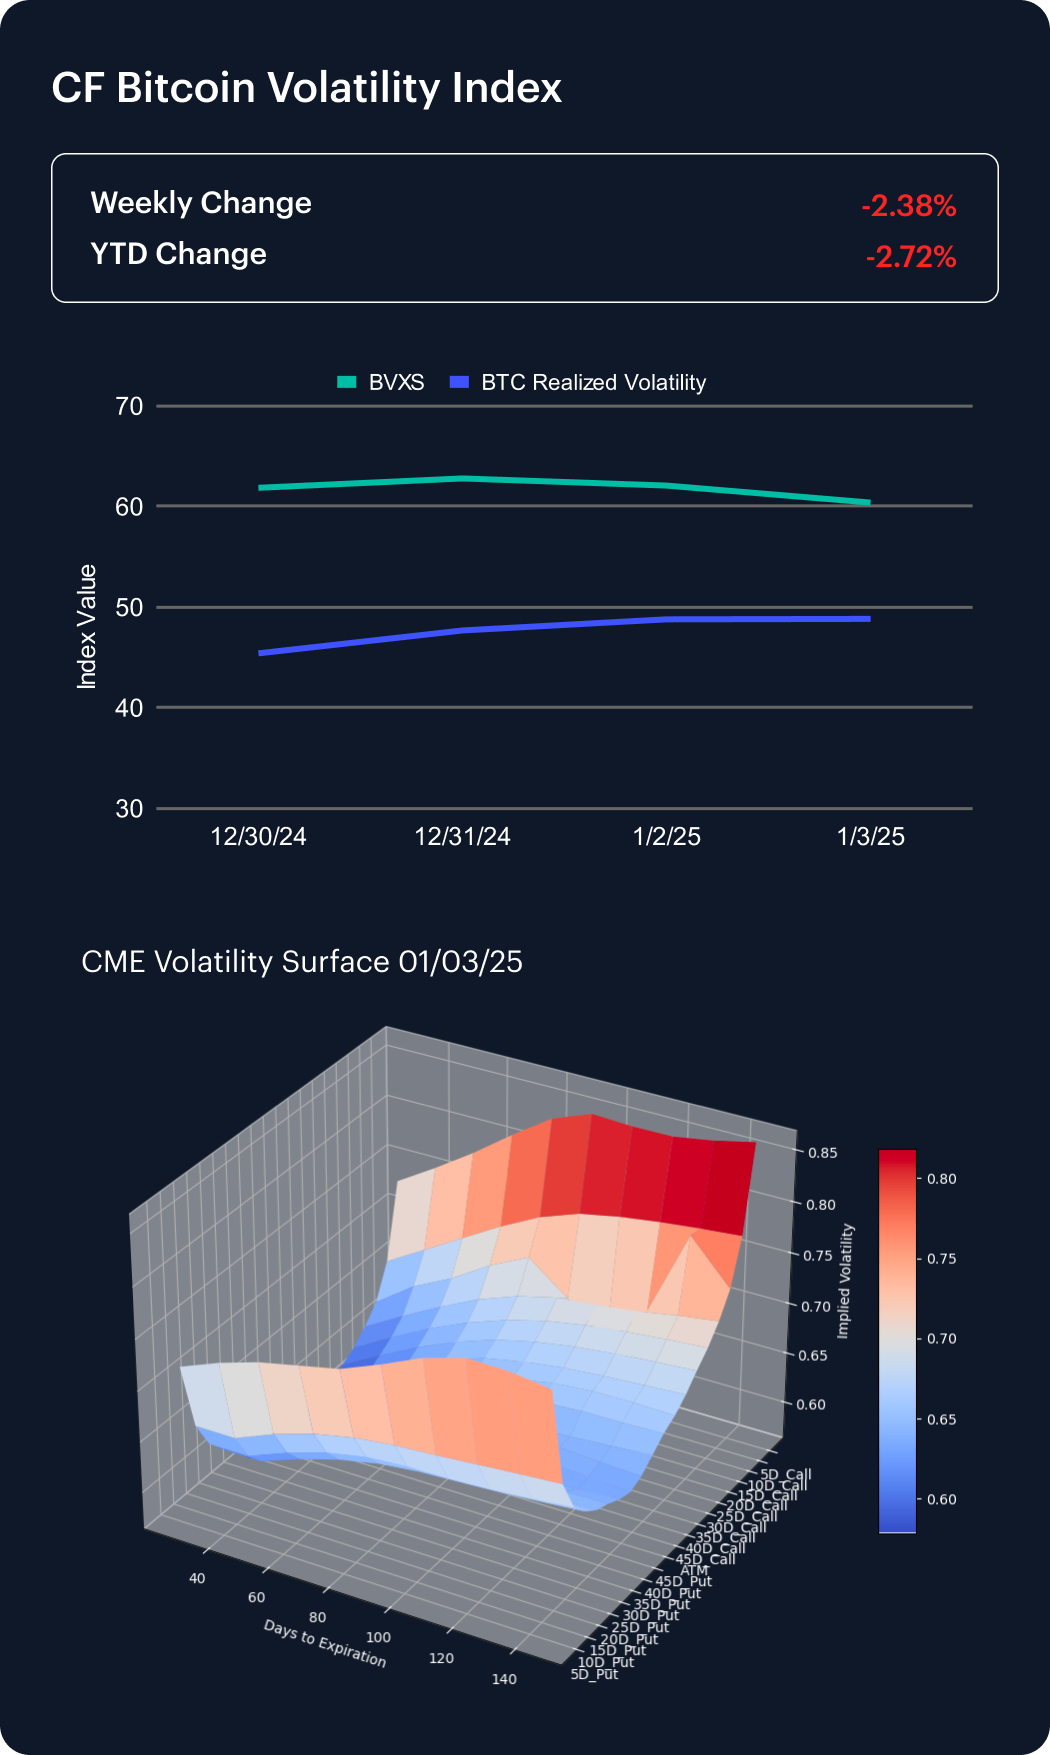
The CF Bitcoin Volatility Index Settlement Rate (BVXS) marked its second consecutive weekly decline, retreating -2.38% amid muted realized volatility conditions. Year-to-date, implied volatility metrics have compressed -2.72%, reflecting a moderation in implied options market risk premiums.
Analysis of the CME Bitcoin Volatility Surface reveals flattening skew characteristics as of January 3rd, 2025, with increased convexity across strike ranges compared to December's patterns. The compression in implied volatility suggests a more normalized demand for tail risk outcomes, as institutional positioning appears more balanced entering the new year. This recent shift is in contrast with the broader increase in spot market volatility following the early January price appreciation, though options market dynamics indicate maintained hedging activity at key technical levels.
Interest Rate Analysis
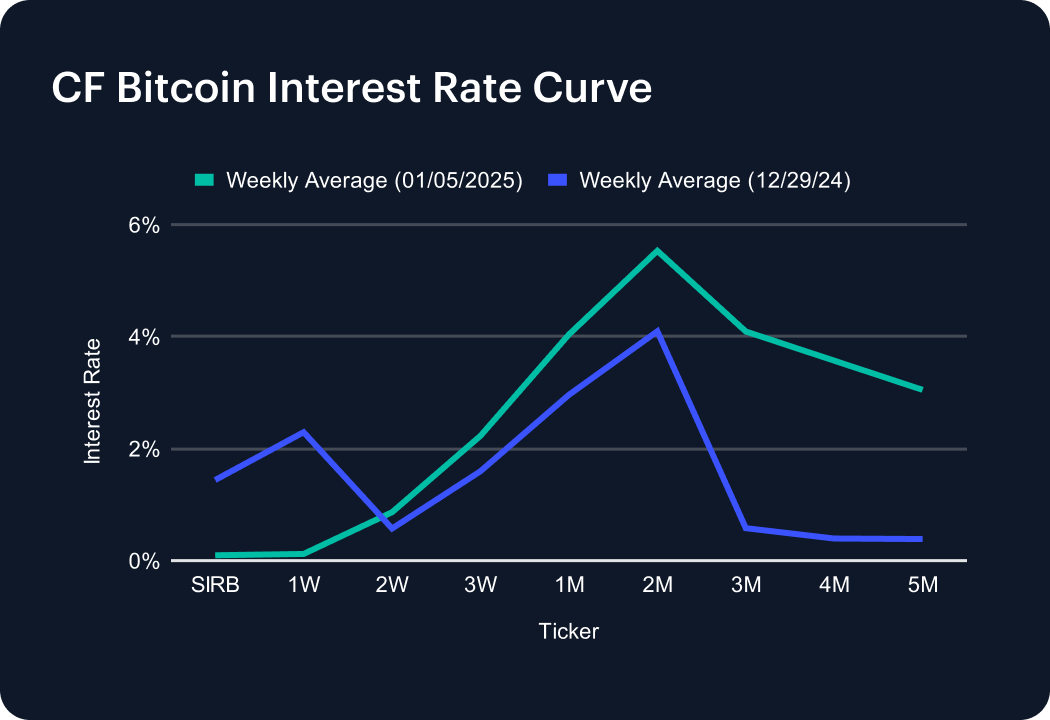
The CF Bitcoin Interest Rate Curve demonstrated significant repricing across all tenors, with particularly notable expansion in medium-term rates. The 2-Month tenor exhibited the strongest positioning at 5.53%, representing a +143 basis point weekly increase, while the 1-Month rate advanced +108 basis points to 4.04%.
Overnight and ultra-short rates experienced notable compression, with the SIRB and 1-Week tenors declining to 0.10% and 0.12% respectively. The longer end of the curve showed sustained activity, with 3-Month through 5-Month rates maintaining an orderly term structure between 4.09% and 3.05%. This steepening of the medium-term curve coupled with front-end compression suggests evolving institutional lending dynamics and potential shifts in Bitcoin collateral preferences for 2025.
The information contained within is for educational and informational purposes ONLY. It is not intended nor should it be considered an invitation or inducement to buy or sell any of the underlying instruments cited including but not limited to cryptoassets, financial instruments or any instruments that reference any index provided by CF Benchmarks Ltd. This communication is not intended to persuade or incite you to buy or sell security or securities noted within. Any commentary provided is the opinion of the author and should not be considered a personalised recommendation. Please contact your financial adviser or professional before making an investment decision.
Note: Some of the underlying instruments cited within this material may be restricted to certain customer categories in certain jurisdictions.
Tracking Bitcoin's Flows
Bitcoin is down 47% from its October high. But behind the drawdown, 13F filings reveal a structural transformation: speculative hedge fund capital is retreating while advisory firms, sovereign wealth funds, and endowments are building permanent allocations. Here's what the ownership data shows.

Gabriel Selby
Kraken MTF Lists Large Cap DTF Perp
EU-domiciled institutional investors can now access a perpetual contract based on Reserve Protocol's multi-token LCAP DTF.

CF Benchmarks
Notice of the Demising of Three Indices Within the Token Market Price Benchmarks Series
The Administrator announces that three Token Market Price Benchmarks Series indices are to be demised.

CF Benchmarks