Jul 27, 2023
From Macro to Micro: Can Narrative Shifts Spark the 'Decoupling'?
With more idiosyncratic narratives emerging, digital asset prices are becoming less correlated with traditional markets.
"There is no such thing as a free lunch"
Renowned Nobel laureate Harry Markowitz once said that diversification is the only "free lunch" in the world of investing. This is because the benefits of a properly diversified portfolio with various asset classes can allow an investor to drastically reduce the overall risk of their portfolio, without materially reducing the portfolio's return potential. To put it simply, diversification is a powerful strategy that enables investors to potentially optimize their gains while safeguarding against unnecessary risks.
In investing, practitioners can use a correlation statistic to measure the association between different financial assets. Correlations range from -1 to 1, with a positive correlation signifying that both assets move together, no correlation meaning there is no relationship, and a negative correlation indicating movement in opposite directions. Investors use it to diversify portfolios and manage risk effectively by selecting assets with low or negative correlations.
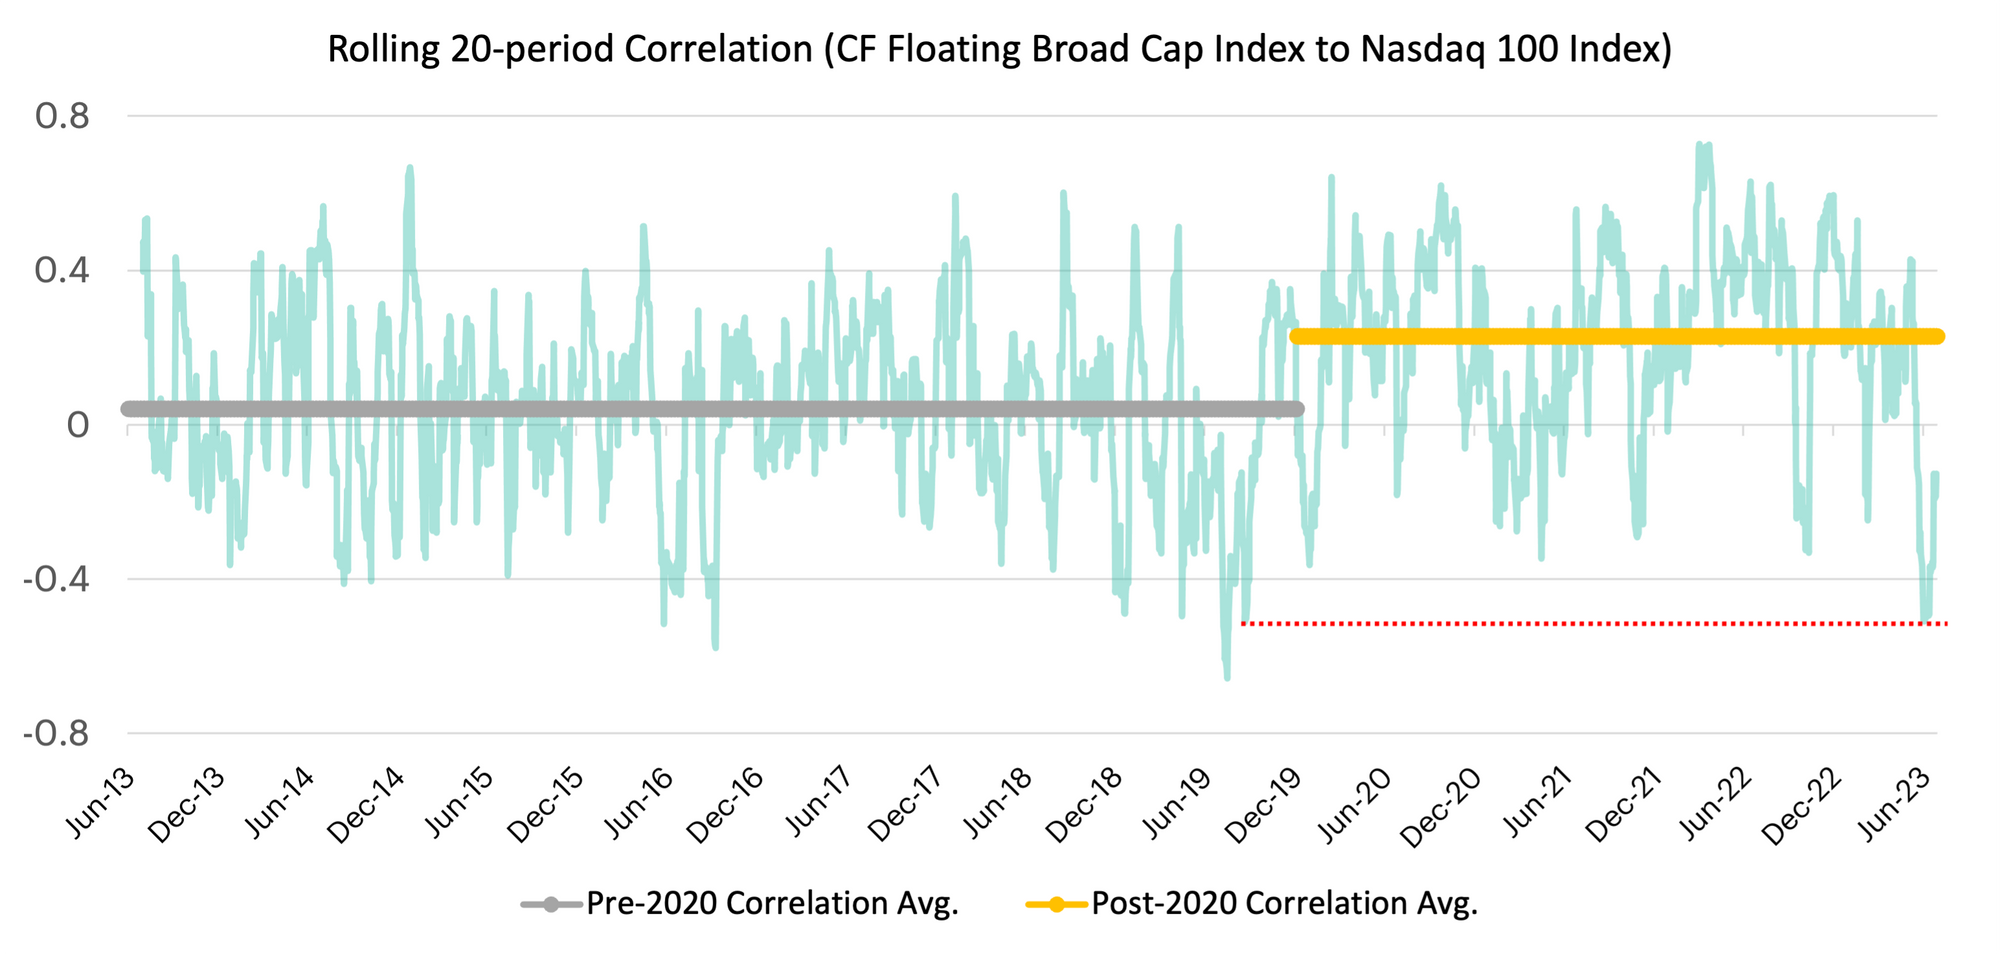
In the early days, one of the key advantages of investing in cryptocurrencies like Bitcoin was its close-to-zero correlation to traditional markets. The illustration below depicts the rolling 20-day correlation of our CF Floating Broad Cap Index with the Nasdaq 100 Index over the past decade (note: I'm using 20 periods since there are typically 5 business days in a week). Prior to 2020, digital assets maintained an average correlation of just 0.04 with the tech-centric equity market index. Many practitioners consider any correlation near zero as an indicator of an uncorrelated asset.
In more recent times, the average correlation of this asset class has risen to 0.23. This has thrown some cold water on the theoretical benefits of using cryptocurrencies as a diversifying piece of an investor's portfolio. However, this metric has recently breached its lowest recorded level since the pre-2020 period.

How did we get here?
Narratives have evolved over time. In 2020, the global pandemic triggered a synchronized wave of monetary and fiscal stimulus, which bolstered financial assets across the risk spectrum, including cryptocurrencies. This led to closely tied pricing relationships. However, the eventual arrival of inflationary pressures meant that these tailwinds would shift to headwinds, reversing the directional bias but keeping these very same pricing relationships between risky and non-risky assets relatively stable.
The illustration below shows statistical correlations between our broadest institutional measure of the crypto market (CF Floating Broad Cap Index) and other indices in various asset classes. Last year, we can see how positively correlated digital assets were to equities during this period of rising interest rates and market volatility, which dominated the headlines.
Correlations have shifted

Possible new catalysts are emerging
Analyzing a more recent period (shown directly above), one can observe the shifting correlations across the board, likely due to a confluence of narratives and potential bullish catalysts discussed below.
- The spot ETF frenzy: Leading asset managers, like BlackRock, may have discovered a formula to meet the S.E.C.'s demands for obtaining regulatory approval for a spot Bitcoin ETF in the U.S. This has triggered a wave of filings from traditional asset managers, who all wish to now offer a regulated and practical way for conventional investors to gain exposure to the world's most valuable digital asset for the very first time. The potential market impacts of this development are significant, as unlocking access to such a fund structure could introduce a new wave of retail and institutional investors to the Bitcoin market for the very first time. (Note: To delve into the nuances of why this time might be different for spot ETF approvals, watch our latest podcast episode.)
- Regulatory clarity: A recent ruling from a federal court has provided some crucial guidance on how tokens are classified as securities or not. The distinction between a token's classification has been a subject of debate since the S.E.C. sued Ripple (XRP) in December 2020. While the debate is not fully settled, early indications from this case suggest that XRP may not always be considered a security. The outcome of this case is anticipated to have a widespread impact on the industry, leading to highly reactionary pricing sentiment towards these tokens.
- Ramping up sound-money principles: The two largest tokens, which currently account for over $700Bn in market cap and approximately 90% combined weight of our CF Floating Broad Cap Index, are experiencing favorable supply dynamics now or in the near future. The approaching bitcoin halving in 2024 will slash block rewards given to miners in half. Meanwhile, last year's Ethereum proof-of-upgrade has provided a consistent deflationary force to its token supply, as more tokens are being "burned" or destroyed through network transactions.
Now we wait and see...
Surely, this observable window is not long enough to extrapolate any definitive structural changes in market correlations between cryptocurrencies and traditional assets. However, as we continue to navigate these shifts from macro to micro narratives, one cannot rule out the possibility of a 'decoupling'. Such a scenario would provide investors with another lever to pull in their portfolio construction process, potentially enabling more opportunities for "free lunches".
The information contained within is for educational and informational purposes ONLY. It is not intended nor should it be considered an invitation or inducement to buy or sell any of the underlying instruments cited including but not limited to cryptoassets, financial instruments or any instruments that reference any index provided by CF Benchmarks Ltd. This communication is not intended to persuade or incite you to buy or sell security or securities noted within. Any commentary provided is the opinion of the author and should not be considered a personalised recommendation. Please contact your financial adviser or professional before making an investment decision.
Note: Some of the underlying instruments cited within this material may be restricted to certain customer categories in certain jurisdictions.

Ken Odeluga

CF Benchmarks

Gabriel Selby


