
Mar 24, 2025
Weekly Index Highlights, March 24, 2025
Market Performance Update
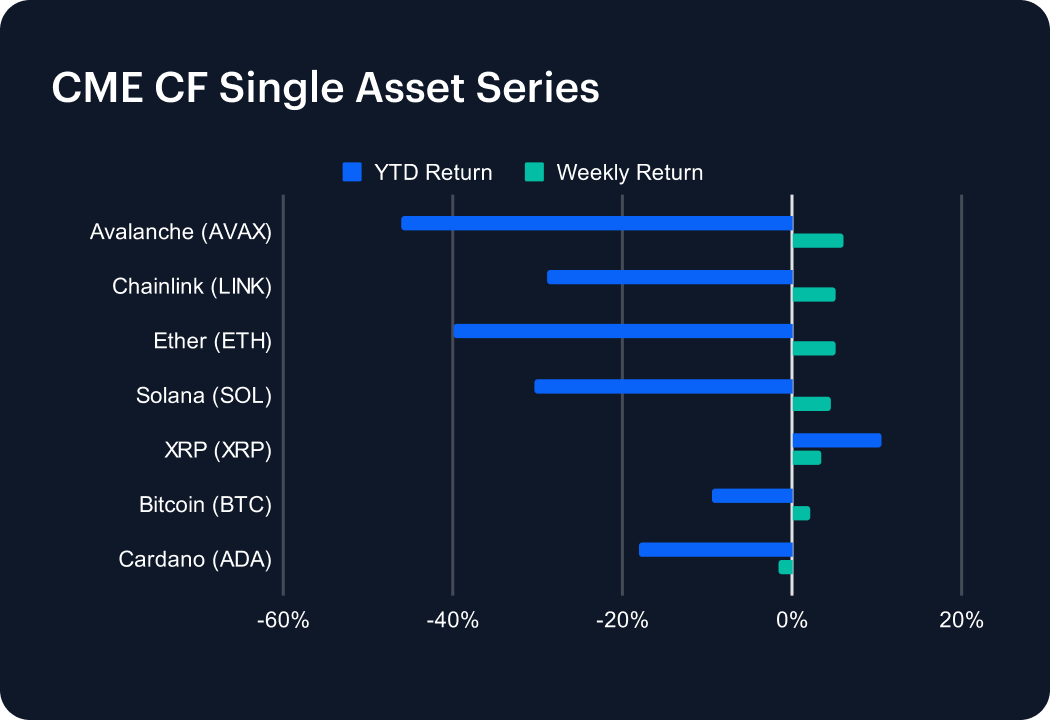
The digital asset market rebounded modestly this week, with most major cryptocurrencies posting gains after recent declines. Avalanche (AVAX) led the recovery, rising 6.04% weekly, though it remains down -46.00% year-to-date (YTD). Chainlink (LINK) added 5.17%, trimming its YTD loss to -28.90%, while Ether (ETH) gained 5.05% but is still down -39.83% YTD. Solana (SOL) advanced 4.53%, bringing its YTD return to -30.39%. XRP continued its positive momentum, up 3.38% on the week and now showing a solid YTD gain of 10.52%. Bitcoin (BTC) edged higher by 2.13%, narrowing its YTD decline to -9.45%. Cardano (ADA) was the sole laggard, slipping -1.66% and extending its YTD drop to -18.11%. Market sentiment remains cautiously optimistic amid shifting macroeconomic signals.
Classification Performance
The CF DACS sub-categories advanced slightly this week, led by strong gains in select tokens. ZRO topped all assets with a 24.60% surge in the Interoperability segment, while Smart Contract Platform EOS climbed 16.15%. Select Meme Coins rebounded sharply, with BONK spiking 22.53% and WIF adding 6.75%. CRV surged 13.54%, and UNI gained 8.41%, lifting the Trading segment. Identity tokens like GAL also outperformed, rising 7.21%. On the downside, JASMY was the week’s biggest laggard, plunging -15.07% in the Computing category. SPELL (-8.49%) and STRK (-7.50%) also underperformed. Overall, leadership came from General Purpose Smart Contract Platform and Meme Coin segments, while losses remained concentrated in small-cap Infrastructure and Social tokens.
Staking Metrics
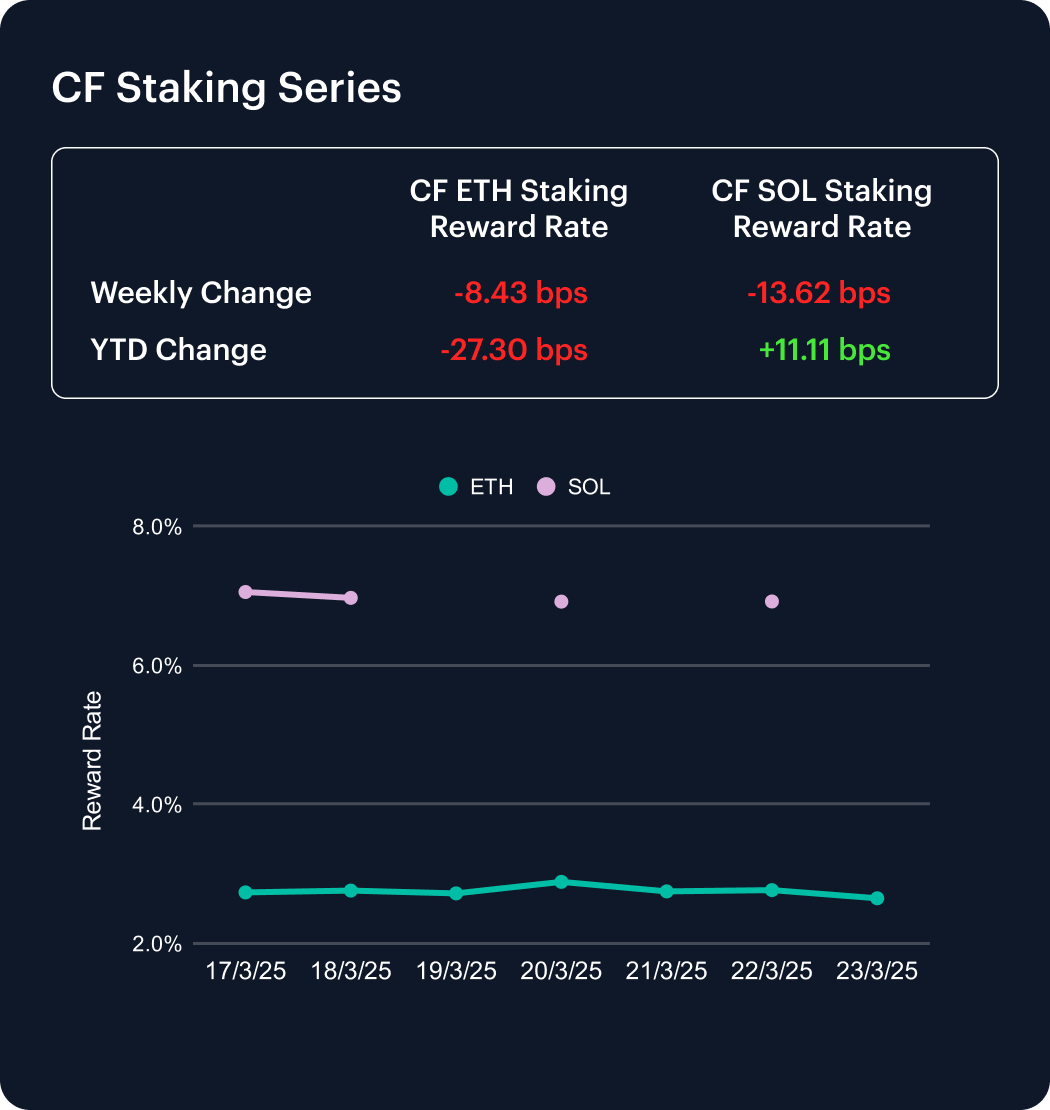
The CF Ether Staking Reward Rate Index (ETH_SRR) declined 8.43 basis points over the past week to 2.65%, marking a -3.08% weekly decrease. Year-to-date, the ETH_SRR has fallen 27.3 bps, reflecting continued downward pressure and a -9.34% YTD decline.
Meanwhile, the CF SOL Staking Reward Rate Index (SOL_SRR) slipped 13.62 bps to 6.92%, posting a -1.93% weekly decline. Despite this pullback, SOL_SRR remains up 11.11 bps for the year, a 1.63% YTD gain. These trends underscore Ethereum’s persistent reward compression, while Solana continues to demonstrate relative resilience in long-term staking yield performance.
Market Cap Index Performance
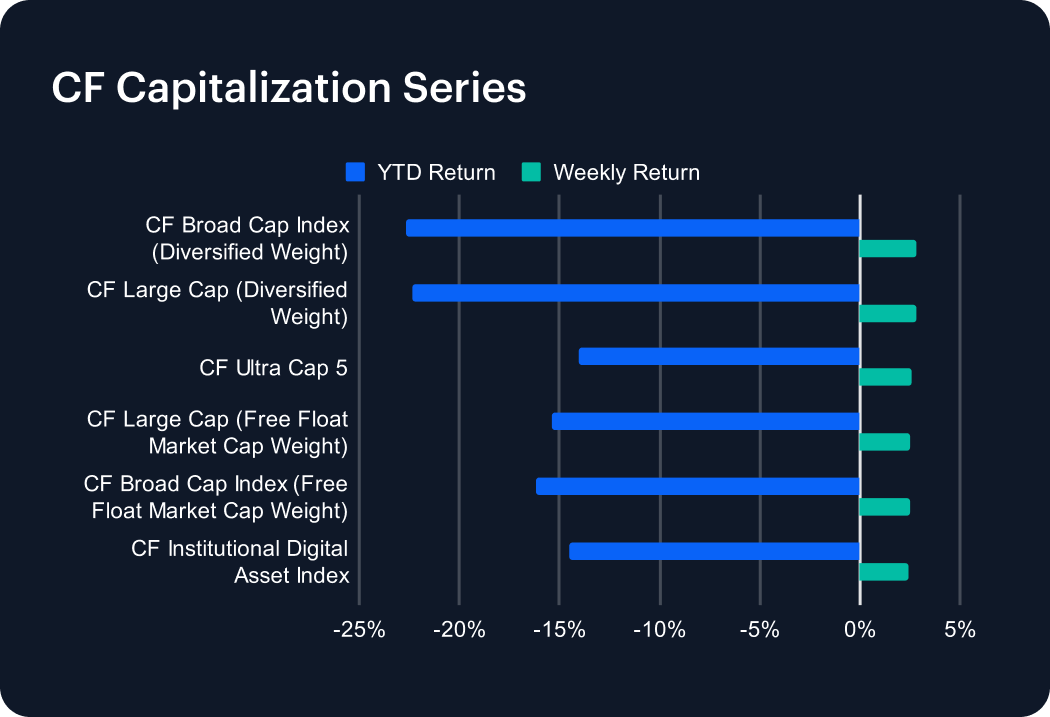
The CF Capitalization Series rebounded modestly this past week, with all major indices posting gains. Diversified-weighted indices slightly outperformed their free-float weighted counterparts. The CF Broad Cap Index (Diversified Weight) led with a 2.84% weekly gain, trimming its year-to-date (YTD) loss to -22.65%. The CF Large Cap Index (Diversified Weight) followed closely, rising 2.80% for the week. Among free-float market cap-weighted indices, both the CF Broad Cap Index and CF Large Cap Index advanced 2.48%, with their YTD returns improving to -16.20% and -15.39%, respectively. The CF Institutional Digital Asset Index added 2.47%, while the CF Ultra Cap 5 climbed 2.55%, bringing its YTD return to -14.04%. Despite the bounce, YTD performance remains in negative territory across the board.
Classification Series Analysis
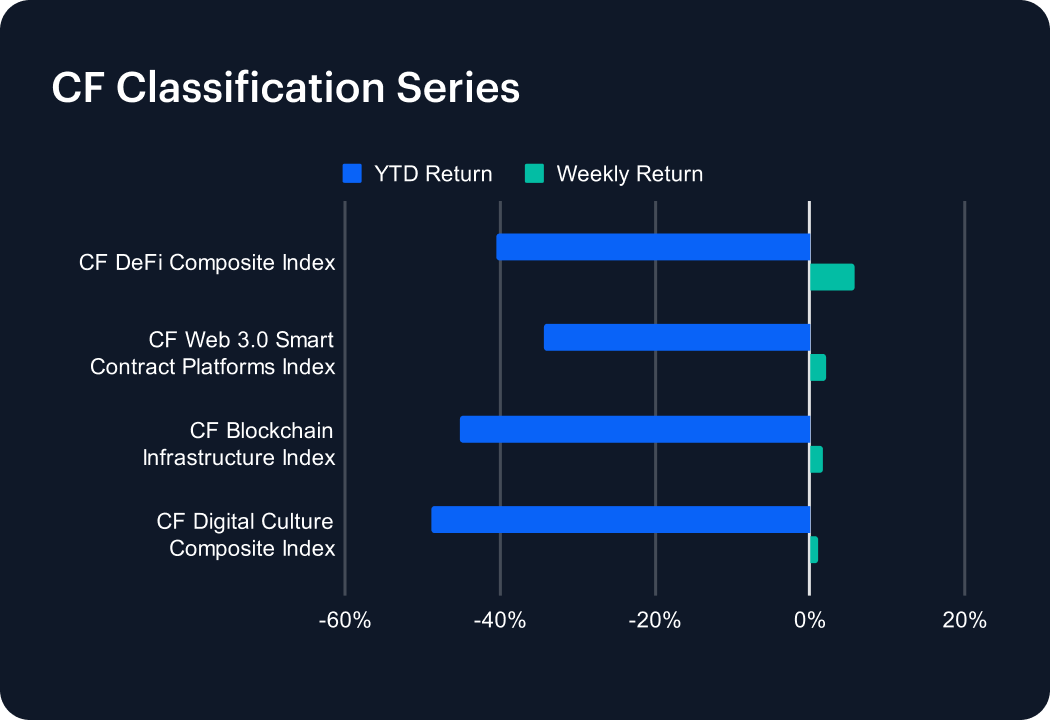
The CF Classification Series posted modest gains this past week, signaling a potential pause in the broader downtrend across digital asset sectors. The CF DeFi Composite Index led the recovery, rising 5.69% on the week, though it remains down -40.52% year-to-date (YTD). The CF Web 3.0 Smart Contract Platforms Index advanced 2.09%, trimming its YTD decline to -34.42%. The CF Blockchain Infrastructure Index edged up 1.63%, but continues to face pressure with a -45.17% YTD return. Meanwhile, the CF Digital Culture Composite Index gained 1.16%, modestly improving its standing but still down -48.88% YTD. While this week’s gains are encouraging, the overall picture remains cautious as YTD performance continues to reflect deep drawdowns.
Volatility Analysis
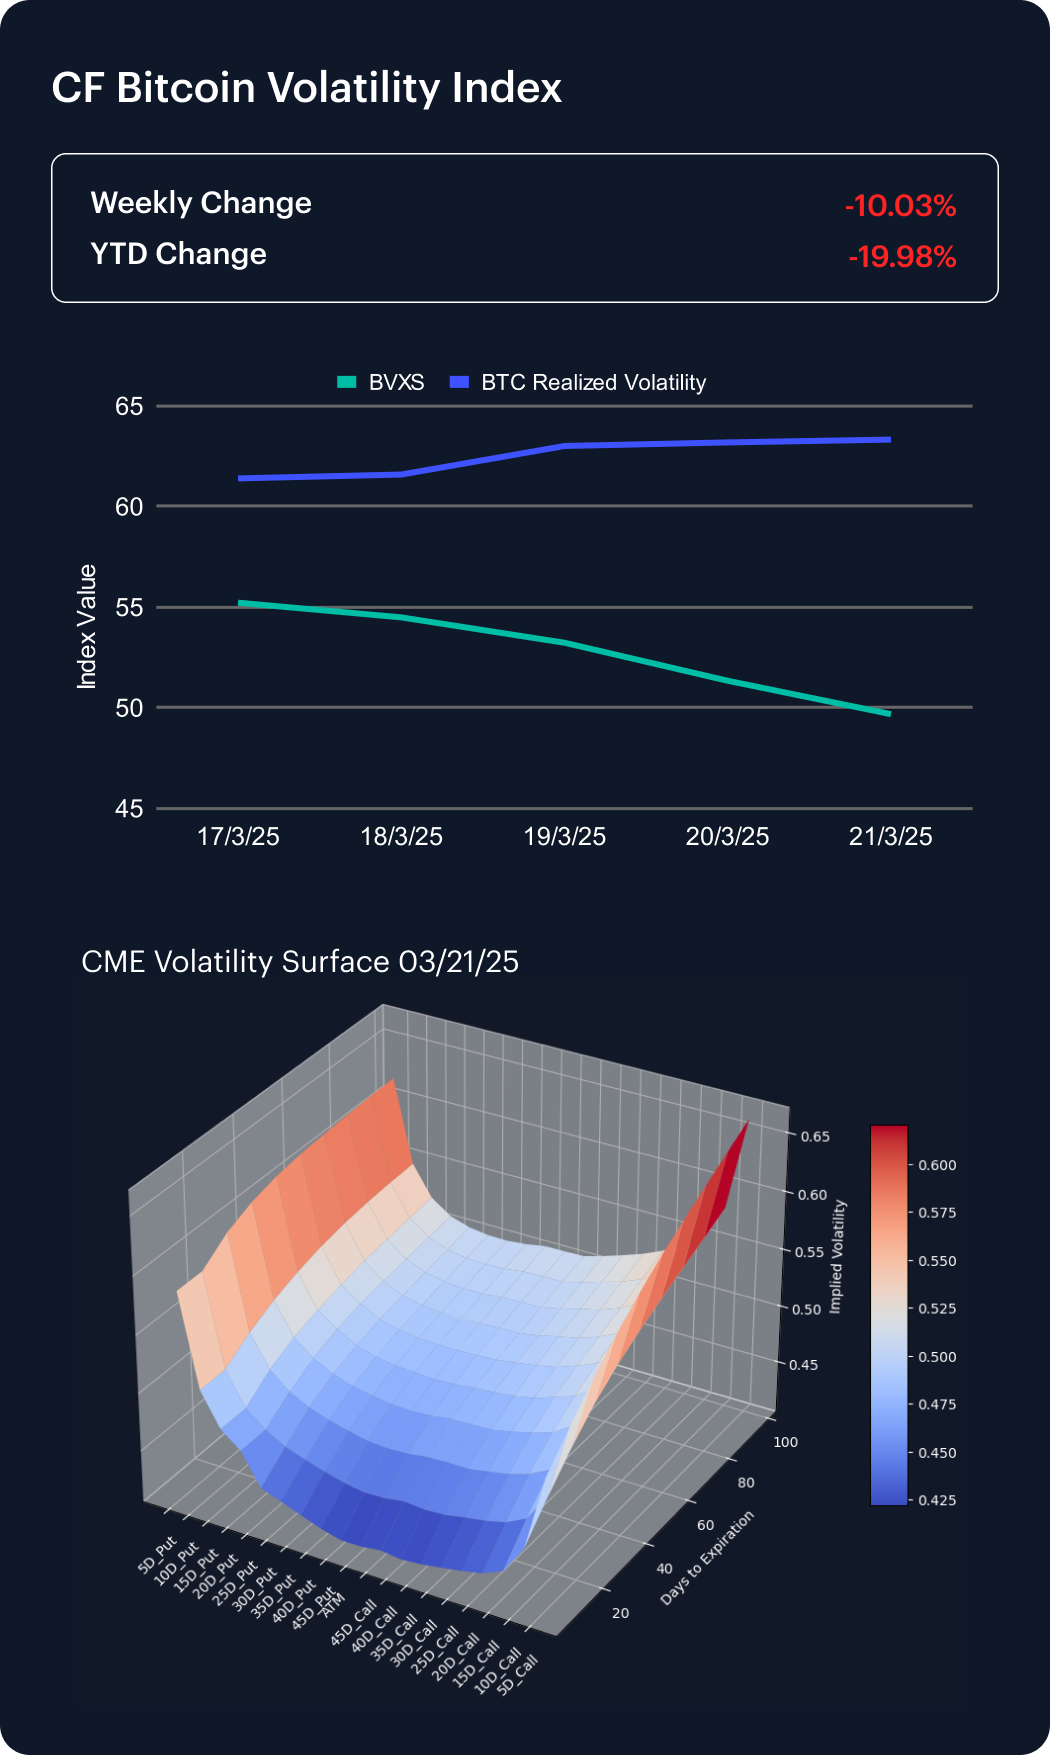
The CF Bitcoin Volatility Index Settlement Rate (BVXS) fell sharply this past week, declining -10.03% to settle at 49.69, deepening its year-to-date drop to -19.98%. Despite this, realized volatility rose steadily, beginning the week at 61.41 and climbing to 63.34, highlighting increased short-term price movement even as implied volatility compresses.
CME Bitcoin Volatility Surface analysis reveals a nuanced shift in sentiment. While 10- and 15-delta skews remain negative, indicating continued demand for deep out-of-the-money puts, the 20- and 25-delta skews have turned positive, suggesting growing interest in upside exposure at closer-to-the-money strikes. Convexity remains elevated, preserving the potential for sharp directional moves. Overall, the market reflects a cautiously balanced outlook, with hedging activity evident on both sides of the distribution amid ongoing volatility.
Interest Rate Analysis
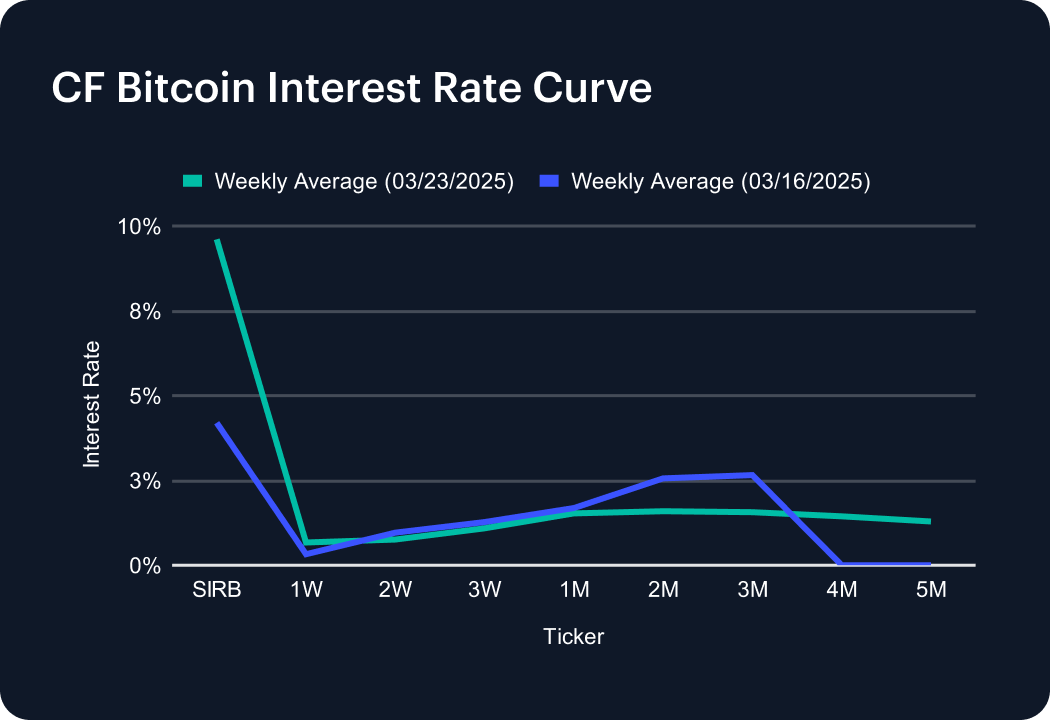
The CF Bitcoin Interest Rate Curve rose meaningfully over the past week, with short-term rates leading the move higher. The Short-Term Interest Rate Benchmark (SIRB) nearly doubled, climbing to 9.61% from 4.20%, reflecting a sharp increase in borrowing costs. The 1-Week rate rose to 0.67% from 0.32%, while the 2-Week and 3-Week tenors declined slightly to 0.76% and 1.09%, respectively. The 1-Month rate eased to 1.53%. Medium-term rates continued to fall, with the 2-Month and 3-Month tenors dropping to 1.59% and 1.56%. Notably, the 4-Month and 5-Month rates reappeared on the curve, settling at 1.44% and 1.29%, indicating renewed market engagement in longer-term borrowing.
The information contained within is for educational and informational purposes ONLY. It is not intended nor should it be considered an invitation or inducement to buy or sell any of the underlying instruments cited including but not limited to cryptoassets, financial instruments or any instruments that reference any index provided by CF Benchmarks Ltd. This communication is not intended to persuade or incite you to buy or sell security or securities noted within. Any commentary provided is the opinion of the author and should not be considered a personalised recommendation. Please contact your financial adviser or professional before making an investment decision.
Note: Some of the underlying instruments cited within this material may be restricted to certain customer categories in certain jurisdictions.


Ken Odeluga

CF Benchmarks

Gabriel Selby